for-loop usage at different nesting levels

Derek Jones from The Shape of Code

When reading code, starting at the first line of a function/method, the probability of the next statement read being a for-loop is around 1.5% (at least in C, I don’t have decent data on other languages). Let’s say you have been reading the code a line at a time, and you are now reading lines nested within various if/while/for statements, you are at nesting depth d. What is the probability of the statement on the next line being a for-loop?

Does the probability of encountering a for-loop remain unchanged with nesting depth (i.e., developer habits are not affected by nesting depth), or does it decrease (aren’t developers supposed to using functions/methods rather than nesting; I have never heard anybody suggest that it increases)?

If you think the for-loop use probability is not affected by nesting depth, you are going to argue for the plot on the left (below, showing number of loops appearing in C source at various nesting depths), with the regression model fitting really well after 3-levels of nesting. If you think the probability decreases with nesting depth, you are likely to argue for the plot on the right, with the model fitting really well down to around 10-levels of nesting (code+data).

Number of C source lines containing a given number of characters.

Both plots use the same data, but different scales are used for the x-axis.

If probability of use is independent of nesting depth, an exponential equation should fit the data (i.e., the left plot), decreasing probability is supported by a power-law (i.e, the right plot; plus other forms of equation, but let’s keep things simple).

The two cases are very wrong over different ranges of the data. What is your explanation for reality failing to follow your beliefs in for-loop occurrence probability?

Is the mismatch between belief and reality caused by the small size of the data set (a few million lines were measured, which was once considered to be a lot), or perhaps your beliefs are based on other languages which will behave as claimed (appropriate measurements on other languages most welcome).

The nesting depth dependent use probability plot shows a sudden change in the rate of decrease in for-loop probability; perhaps this is caused by the maximum number of characters that can appear on a typical editor line (within a window). The left plot (below) shows the number of lines (of C source) containing a given number of characters; the right plot counts tokens per line and the length effect is much less pronounced (perhaps developers use shorter identifiers in nested code). Note: different scales used for the x-axis (code+data).

Number of lines containing a given number of C tokens.

I don’t have any believable ideas for why the exponential fit only works if the first few nesting depths are ignored. What could be so special about early nesting depths?

What about fitting the data with other equations?

A bi-exponential springs to mind, with one exponential driven by application requirements and the other by algorithm selection; but reality is not on-board with this idea.

Ideas, suggestions, and data for other languages, most welcome.

The dark-age of software engineering research: some evidence

Derek Jones from The Shape of Code

Looking back, the 1970s appear to be a golden age of software engineering research, with the following decades being the dark ages (i.e., vanity research promoted by ego and bluster), from which we are slowly emerging (a rough timeline).

Lots of evidence-based software engineering research was done in the 1970s, relative to the number of papers published, and I have previously written about the quantity of research done at Rome and the rise of ego and bluster after its fall (Air Force officers studying for a Master’s degree publish as much software engineering data as software engineering academics combined during the 1970s and the next two decades).

What is the evidence for a software engineering research dark ages, starting in the 1980s?

One indicator is the extent to which ancient books are still venerated, and the wisdom of the ancients is still regularly cited.

I claim that my evidence-based software engineering book contains all the useful publicly available software engineering data. The plot below shows the number of papers cited (green) and data available (red), per year; with fitted exponential regression models, and a piecewise regression fit to the data (blue) (code+data).

Count of papers cited and data available, per year.

The citations+date include works that are not written by people involved in software engineering research, e.g., psychology, economics and ecology. For the time being I’m assuming that these non-software engineering researchers contribute a fixed percentage per year (the BibTeX file is available if anybody wants to do the break-down)

The two straight line fits are roughly parallel, and show an exponential growth over the years.

The piecewise regression (blue, loess was used) shows that the rate of growth in research data leveled-off in the late 1970s and only started to pick up again in the 1990s.

The dip in counts during the last few years is likely to be the result of me not having yet located all the recent empirical research.

Performance variation in 2,386 ‘identical’ processors

Derek Jones from The Shape of Code

Every microprocessor is different, random variations in the manufacturing process result in transistors, and the connections between them, being fabricated with more/less atoms. An atom here and there makes very little difference when components are built from millions, or even thousands, of atoms. The width of the connections between transistors in modern devices might only be a dozen or so atoms, and an atom here and there can have a noticeable impact.

How does an atom here and there affect performance? Don’t all processors, of the same product, clocked at the same frequency deliver the same performance?

Yes they do, an atom here or there does not cause a processor to execute more/less instructions at a given frequency. But an atom here and there changes the thermal characteristics of processors, i.e., causes them to heat up faster/slower. High performance processors will reduce their operating frequency, or voltage, to prevent self-destruction (by overheating).

Processors operating within the same maximum power budget (say 65 Watts) may execute more/less instructions per second because they have slowed themselves down.

Some years ago I spotted a great example of ‘identical’ processor performance variation, and the author of the example, Barry Rountree, kindly sent me the data. In the weeks before Christmas I finally got around to including the data in my evidence-based software engineering book. Unfortunately I could not figure out what was what in the data (relearning an important lesson: make sure to understand the data as soon as it arrives), thankfully Barry came to the rescue and spent some time doing software archeology to figure out the data.

The original plots showed frequency/time data of 2,386 Intel Sandy Bridge XEON processors (in a high performance computer at the Lawrence Livermore National Laboratory) executing the EP benchmark (the data also includes measurements from the MG benchmark, part of the NAS Parallel benchmark) at various maximum power limits (see plot at end of post, which is normalised based on performance at 115 Watts). The plot below shows frequency/time for a maximum power of 65 Watts, along with violin plots showing the spread of processors running at a given frequency and taking a given number of seconds (my code, code+data on Barry’s github repo):

Frequency vs Time at 65 Watts

The expected frequency/time behavior is for processors to lie along a straight line running from top left to bottom right, which is roughly what happens here. I imagine (waving my software arms about) the variation in behavior comes from interactions with the other hardware devices each processor is connected to (e.g., memory, which presumably have their own temperature characteristics). Memory performance can have a big impact on benchmark performance. Some of the other maximum power limits have very different, and benchmark, measurements have very different characteristics (see below).

More details and analysis in the paper: An empirical survey of performance and energy efficiency variation on Intel processors.

Intel’s Sandy Bridge is now around seven years old, and the number of atoms used to fabricate transistors and their connectors has shrunk and shrunk. An atom here and there is likely to produce even more variation in the performance of today’s processors.

A previous post discussed the impact of a variety of random variations on program performance.

Below is a png version of the original plot I saw:

Frequency vs Time at all power levels

Reliability chapter of ‘evidence-based software engineering’ updated

Derek Jones from The Shape of Code

The Reliability chapter of my evidence-based software engineering book has been updated (draft pdf).

Unlike the earlier chapters, there were no major changes to the initial version from over 18-months ago; we just don’t know much about software reliability, and there is not much public data.

There are lots of papers published claiming to be about software reliability, but they are mostly smoke-and-mirror shows derived from work down one of several popular rabbit holes:

The growth in research on Fuzzing is the only good news (especially with the availability of practical introductory material).

There is one source of fault experience data that looks like it might be very useful, but it’s hard to get hold of; NASA has kept detailed about what happened using space missions. I have had several people promise to send me data, but none has arrived yet :-(.

Updating the reliability chapter did not take too much time, so I updated earlier chapters with data that has arrived since they were last released.

As always, if you know of any interesting software engineering data, please tell me.

Next, the Source code chapter.

The Renzo Pomodoro dataset

Derek Jones from The Shape of Code

Estimating how long it will take to complete a task is hard work, and the most common motivation for this work comes from external factors, e.g., the boss, or a potential client asks for an estimate to do a job.

People also make estimates for their own use, e.g., when planning work for the day. Various processes and techniques have been created to help structure the estimation process; for developers there is the Personal Software Process, and specifically for time estimation (but not developer specific), there is the Pomodoro Technique.

I met Renzo Borgatti at the first talk I gave on the SiP dataset (Renzo is the organizer of the Papers We Love meetup). After the talk, Renzo told me about his use of the Pomodoro Technique, and how he had 10-years worth of task estimates; wow, I was very interested. What happened next, and a work-in-progress analysis (plus data and R scripts) of the data can be found in the Renzo Pomodoro dataset repo.

The analysis progressed in fits and starts; like me Renzo is working on a book, and is very busy. The work-in-progress pdf is reasonably consistent.

I had never seen a dataset of estimates made for personal use, and had not read about the analysis of such data. When estimates are made for consumption by others, the motives involved in making the estimate can have a big impact on the values chosen, e.g., underestimating to win a bid, or overestimating to impress the boss by completing a task under budget. Is a personal estimate motive free? The following plot led me to ask Renzo if he was superstitious (in not liking odd numbers).

Number of tasks having a given number of estimate and actual Pomodoro values.

The plot shows the number of tasks for which there are a given number of estimates and actuals (measured in Pomodoros, i.e., units of 25 minutes). Most tasks are estimated to require one Pomodoro, and actually require this amount of effort.

Renzo educated me about the details of the Pomodoro technique, e.g., there is a 15-30 minute break after every four Pomodoros. Did this mean that estimates of three Pomodoros were less common because the need for a break was causing Renzo to subconsciously select an estimate of two or four Pomodoro? I am not brave enough to venture an opinion about what is going on in Renzo’s head.

Each estimated task has an associated tag name (sometimes two), which classifies the work involved, e.g., @planning. In the task information these tags have the form @word; I refer to them as at-words. The following plot is very interesting; it shows the date of use of each at-word, over time (ordered by first use of the at-word).

at-words usage, by date.

The first and third black lines are fitted regression models of the form 1-e^{-K*days}, where: K is a constant and days is the number of days since the start of the interval fitted. The second (middle) black line is a fitted straight line.

The slow down in the growth of new at-words suggests (at least to me) a period of time working in the same application domain (which involves a fixed number of distinct activities, that are ‘discovered’ by Renzo over time). More discussion with Renzo is needed to see if we can tie this down to what he was working on at the time.

I have looked for various other patterns and associations, involving at-words, but have not found any (but I did learn some new sequence analysis techniques, and associated R packages).

The data is now out there. What patterns and associations can you find?

Renzo tells me that there is a community of people using the Pomodoro technique. I’m hoping that others users of this technique, involved in software development, have recorded their tasks over a long period (I don’t think I could keep it up for longer than a week).

Perhaps there are PSP followers out there with data…

I offer to do a free analysis of software engineering data, provided I can make data public (in anonymized form). Do get in touch.

Calculating statement execution likelihood

Derek Jones from The Shape of Code

In the following code, how often will the variable b be incremented, compared to a?

If we assume that the variables x and y have values drawn from the same distribution, then the condition (x < y) will be true 50% of the time (ignoring the situation where both values are equal), i.e., b will be incremented half as often as a.

a++;
if (x < y)
   {
   b++;
   if (x < z)
      {
      c++;
      }
   }

If the value of z is drawn from the same distribution as x and y, how often will c be incremented compared to a?

The test (x < y) reduces the possible values that x can take, which means that in the comparison (x < z), the value of x is no longer drawn from the same distribution as z.

Since we are assuming that z and y are drawn from the same distribution, there is a 50% chance that (z < y).

If we assume that (z < y), then the values of x and z are drawn from the same distribution, and in this case there is a 50% change that (x < z) is true.

Combining these two cases, we deduce that, given the statement a++; is executed, there is a 25% probability that the statement c++; is executed.

If the condition (x < z) is replaced by (x > z), the expected probability remains unchanged.

If the values of x, y, and z are not drawn from the same distribution, things get complicated.

Let's assume that the probability of particular values of x and y occurring are alpha e^{-sx} and beta e^{-ty}, respectively. The constants alpha and beta are needed to ensure that both probabilities sum to one; the exponents s and t control the distribution of values. What is the probability that (x < y) is true?

Probability theory tells us that P(A < B) = int{-infty}{+infty} f_B(x) F_A(x) dx, where: f_B is the probability distribution function for B (in this case: beta e^{-tx}), and F_A the the cumulative probability distribution for A (in this case: alpha(1-e^{-sx})).

Doing the maths gives the probability of (x < y) being true as: {alpha beta s}/{s+t}.

The (x < z) case can be similarly derived, and combining everything is just a matter of getting the algebra right; it is left as an exercise to the reader :-)

Christmas books for 2019

Derek Jones from The Shape of Code

The following are the really, and somewhat, interesting books I read this year. I am including the somewhat interesting books to bulk up the numbers; there are probably more books out there that I would find interesting. I just did not read many books this year, what with Amazon recommends being so user unfriendly, and having my nose to the grindstone finishing a book.

First the really interesting.

I have already written about Good Enough: The Tolerance for Mediocrity in Nature and Society by Daniel Milo.

I have also written about The European Guilds: An economic analysis by Sheilagh Ogilvie. Around half-way through I grew weary, and worried readers of my own book might feel the same. Ogilvie nails false beliefs to the floor and machine-guns them. An admirable trait in someone seeking to dispel the false beliefs in current circulation. Some variety in the nailing and machine-gunning would have improved readability.

Moving on to first half really interesting, second half only somewhat.

“In search of stupidity: Over 20 years of high-tech marketing disasters” by Merrill R. Chapman, second edition. This edition is from 2006, and a third edition is promised, like now. The first half is full of great stories about the successes and failures of computer companies in the 1980s and 1990s, by somebody who was intimately involved with them in a sales and marketing capacity. The author does not appear to be so intimately involved, starting around 2000, and the material flags. Worth buying for the first half.

Now the somewhat interesting.

“Can medicine be cured? The corruption of a profession” by Seamus O’Mahony. All those nonsense theories and practices you see going on in software engineering, it’s also happening in medicine. Medicine had a golden age, when progress was made on finding cures for the major diseases, and now it’s mostly smoke and mirrors as people try to maintain the illusion of progress.

“Who we are and how we got here” by David Reich (a genetics professor who is a big name in the field), is the story of the various migrations and interbreeding of ‘human-like’ and human peoples over the last 50,000 years (with some references going as far back as 300,000 years). The author tries to tell two stories, the story of human migrations and the story of the discoveries made by his and other people’s labs. The mixture of stories did not work for me; the story of human migrations/interbreeding was very interesting, but I was not at all interested in when and who discovered what. The last few chapters went off at a tangent, trying to have a politically correct discussion about identity and race issues. The politically correct class are going to hate this book’s findings.

“The Digital Party: Political organization and online democracy” by Paolo Gerbaudo. The internet has enabled some populist political parties to attract hundreds of thousands of members. Are these parties living up to their promises to be truly democratic and representative of members wishes? No, and Gerbaudo does a good job of explaining why (people can easily join up online, and then find more interesting things to do than read about political issues; only a few hard code members get out from behind the screen and become activists).

Suggestions for books that you think I might find interesting welcome.

A study, a replication, and a rebuttal; SE research is starting to become serious

Derek Jones from The Shape of Code

tldr; A paper makes various claims based on suspect data. A replication finds serious problems with the data extraction and analysis. A rebuttal paper spins the replication issues as being nothing serious, and actually validating the original results, i.e., the rebuttal is all smoke and mirrors.

When I first saw the paper: A Large-Scale Study of Programming Languages and Code Quality in Github, the pdf almost got deleted as soon as I started scanning the paper; it uses number of reported defects as a proxy for code quality. The number of reported defects in a program depends on the number of people using the program, more users will generate more defect reports. Unfortunately data on the number of people using a program is extremely hard to come by (I only know of one study that tried to estimate number of users); studies of Java have also found that around 40% of reported faults are requests for enhancement. Most fault report data is useless for the model building purposes to which it is put.

Two things caught my eye, and I did not delete the pdf. The authors have done good work in the past, and they were using a zero-truncated negative binomial distribution; I thought I was the only person using zero-truncated negative binomial distributions to analyze software engineering data. My data analysis alter-ego was intrigued.

Spending a bit more time on the paper confirmed my original view, it’s conclusions were not believable. The authors had done a lot of work, this was no paper written over a long weekend, but lots of silly mistakes had been made.

Lots of nonsense software engineering papers get published, nothing to write home about. Everybody gets writes a nonsense paper at some point in their career, hopefully they get caught by reviewers and are not published (the statistical analysis in this paper was probably above the level familiar to most software engineering reviewers). So, move along.

At the start of this year, the paper: On the Impact of Programming Languages on Code Quality: A Reproduction Study appeared, published in TOPLAS (the first was in CACM, both journals of the ACM).

This replication paper gave a detailed analysis of the mistakes in data extraction, and the sloppy data analyse performed in the original work. Large chunks of the first study were cut to pieces (finding many more issues than I did, but not pointing out the missing usage data). Reading this paper now, in more detail, I found it a careful, well argued, solid piece of work.

This publication is an interesting event. Replications are rare in software engineering, and this is the first time I have seen a take-down (of an empirical paper) like this published in a major journal. Ok, there have been previous published disagreements, but this is machine learning nonsense.

The Papers We Love meetup group ran a mini-workshop over the summer, and Jan Vitek gave a talk on the replication work (unfortunately a problem with the AV system means the videos are not available on the Papers We Love YouTube channel). I asked Jan why they had gone to so much trouble writing up a replication, when they had plenty of other nonsense papers to choose from. His reasoning was that the conclusions from the original work were starting to be widely cited, i.e., new, incorrect, community-wide beliefs were being created. The finding from the original paper, that has been catching on, is that programs written in some languages are more/less likely to contain defects than programs written in other languages. What I think is actually being measured is number of users of the programs written in particular languages (a factor not present in the data).

Yesterday, the paper Rebuttal to Berger et al., TOPLAS 2019 appeared, along with a Medium post by two of the original authors.

The sequence: publication, replication, rebuttal is how science is supposed to work. Scientists disagree about published work and it all gets thrashed out in a series of published papers. I’m pleased to see this is starting to happen in software engineering, it shows that researchers care and are willing to spend time analyzing each others work (rather than publishing another paper on the latest trendy topic).

From time to time I had considered writing a post about the first two articles, but an independent analysis of the data meant some serious thinking, and I was not that keen (since I did not think the data went anywhere interesting).

In the academic world, reputation and citations are the currency. When one set of academics publishes a list of mistakes, errors, oversights, blunders, etc in the published work of another set of academics, both reputation and citations are on the line.

I have not read many academic rebuttals, but one recurring pattern has been a pointed literary style. The style of this Rebuttal paper is somewhat breezy and cheerful (the odd pointed phrase pops out every now and again), attempting to wave off what the authors call general agreement with some minor differences. I have had some trouble understanding how the rebuttal points discussed are related to the problems highlighted in the replication paper. The tone of the medium post is that there is nothing to see here, let’s all move on and be friends.

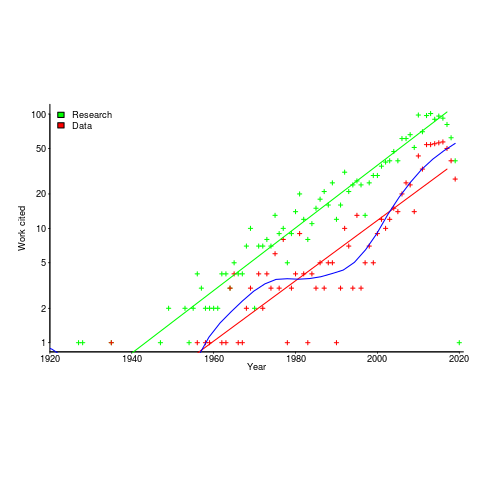
An academic’s work is judged by the number of citations it has received. Citations are used to help decide whether someone should be promoted, or awarded a grant. As I write this post, Google Scholar listed 234 citations to the original paper (which is a lot, most papers have one or none). The abstract of the Rebuttal paper ends with “…and our paper is eminently citable.”

The claimed “Point-by-Point Rebuttal” takes the form of nine alleged claims made by the replication authors. In four cases the Claim paragraph ends with: “Hence the results may be wrong!”, in two cases with: “Hence, FSE14 and CACM17 can’t be right.” (these are references to the original conference and journal papers, respectively), and once with: “Thus, other problems may exist!”

The rebuttal points have a tenuous connection to the major issues raised by the replication paper, and many of them are trivial issues (compared to the real issues raised).

Summary bullet points (six of them) at the start of the Rebuttal discuss issues not covered by the rebuttal points. My favourite is the objection bullet point claiming a preference, in the replication, for the use of the Bonferroni correction rather than FDR (False Discovery Rate). The original analysis failed to use either technique, when it should have used one or the other, a serious oversight; the replication is careful and does the analysis using both.

I would be very surprised if the Rebuttal paper, in its current form, gets published in any serious journal; it’s currently on a preprint server. It is not a serious piece of work.

Somebody who has only read the Rebuttal paper would take away a strong impression that the criticisms in the replication paper were trivial, and that the paper was not a serious piece of work.

What happens next? Will the ACM appoint a committee of the great and the good to decide whether the CACM article should be retracted? We are not talking about fraud or deception, but a bunch of silly mistakes that invalidate the claimed findings. Researchers are supposed to care about the integrity of published work, but will anybody be willing to invest the effort needed to get this paper retracted? The authors will not want to give up those 234, and counting, citations.

Design considerations for Mars colony computer systems

Derek Jones from The Shape of Code

A very interesting article discussing SpaceX’s dramatically lower launch costs has convinced me that, in a decade or two, it will become economically viable to send people to Mars. Whether lots of people will be willing to go is another matter, but let’s assume that a non-trivial number of people decide to spend many years living in a colony on Mars; what computing hardware and software should they take with them?

Reliability and repairability are crucial. Same-day delivery of replacement parts is not an option; the opportunity for Earth/Mars travel occurs every 2-years (when both planets are on the same side of the Sun), and the journey takes 4-10 months.

Given the much higher radiation levels on Mars (200 mS/year; on Earth background radiation is around 3 mS/year), modern microelectronics will experience frequent bit-flips and have a low survival rate. Miniaturization is great for packing billions of transistors into a device, but increases the likelihood that a high energy particle traveling through the device will create a permanent short-circuit; Moore’s law has a much shorter useful life on Mars, compared to Earth. The lesser high energy particles can flip the current value of one or more bits.

Reliability and repairability of electronics, compared to other compute and control options, dictates minimizing the use of electronics (pneumatics is a viable replacement for many tasks; think World War II submarines), and simple calculation can be made using a slide rule or mechanical calculator (both are reliable, and possible to repair with simple tools). Some of the issues that need to be addressed when electronic devices are a proposed solution include:

  • integrated circuits need to be fabricated with feature widths that are large enough such that devices are not unduly affected by background radiation,
  • devices need to be built from exchangeable components, so if one breaks the others can be used as spares. Building a device from discrete components is great for exchangeability, but is not practical for building complicated cpus; one solution is to use simple cpus, and integrated circuits come in various sizes.
  • use of devices that can be repaired or new ones manufactured on Mars. For instance, core memory might be locally repairable, and eventually locally produced.

There are lots of benefits from using the same cpu for everything, with ARM being the obvious choice. Some might suggest RISC-V, and perhaps this will be a better choice many years from now, when a Mars colony is being seriously planned.

Commercially available electronic storage devices have lifetimes measured in years, with a few passive media having lifetimes measured in decades (e.g., optical media); some early electronic storage devices had lifetimes likely to be measured in decades. Perhaps it is possible to produce hard discs with expected lifetimes measured in decades, research is needed (or computing on Mars will have to function without hard discs).

The media on which the source is held will degrade over time. Engraving important source code on the walls of colony housing is one long term storage technique; rather like the hieroglyphs on ancient Egyptian buildings.

What about displays? Have lots of small, same size, flat-screens, and fit them together for greater surface area. I don’t know much about displays, so won’t say more.

Computers built from discrete components consume lots of power (much lower power consumption is a benefit of fabricating smaller devices). No problem, they can double as heating systems. Switching power supplies can be very reliable.

Radio communications require electronics. The radios on the Voyager spacecraft have been operating for 42 years, which suggests to me that reliable communication equipment can be built (I know very little about radio electronics).

What about the software?

Repairability requires that software be open source, or some kind of Mars-use only source license.

The computer language of choice is obviously C, whose advantages include:

  • lots of existing, heavily used, operating systems are written in C (i.e., no need to write, and extensively test, a new one),
  • C compilers are much easier to implement than, say, C++ or Java compilers. If the C compiler gets lost, somebody could bootstrap another one (lots of individuals used to write and successfully sell C compilers),
  • computer storage will be a premium on Mars based computers, and C supports getting close to the hardware to maximise efficient use of resources.

The operating system of choice may not be Linux. With memory at a premium, operating systems requiring many megabytes are bad news. Computers with 64k of storage (yes, kilobytes) used to be used to do lots of useful work; see the source code of various 1980’s operating systems.

Applications can be written before departure. Maintainability and readability are marketing terms, i.e., we don’t really know how to do this stuff. Extensive testing is a good technique for gaining confidence that software behaves as expected, and the test suite can be shipped with the software.

Adjectives in source code analysis

Derek Jones from The Shape of Code

The use of adjectives to analysis source code is something of a specialist topic. This post can only increase the number of people using adjectives for this purpose (because I don’t know anybody else who does 😉

Until recently the only adjective related property I used to help analyse source was relative order. When using multiple adjective, people have a preferred order, e.g., in English size comes before color, as in “big red” (“red big” sounds wrong), and adjectives always appear before the noun they modify. Native speakers of different languages have various preferred orders. Source code may appear to only contain English words, but adjective order can provide a clue about the native language of the developer who wrote it, because native ordering leaks into English usage.

Searching for adjective patterns (or any other part-of-speech pattern) in identifiers used to be complicated (identifiers first had to be split into their subcomponents). Now, thanks to Vadim Markovtsev, 49 million token-split identifiers are available. Happy adjective pattern matching (Size Shape Age Color is a common order to start with; adjective pairs are found in around 0.1% of identifiers; some scripts).

Until recently, gradable adjectives were something that I had been vaguely aware of; these kinds of adjectives indicate a position on a scale, e.g., hot/warm/cold water. The study Grounding Gradable Adjectives through Crowdsourcing included some interesting data on the perceived change of an attribute produced by the presence by a gradable adjective. The following plot shows perceived change in quantity produced by some quantity adjectives (code+data):

Gradable adjective ranking.

How is information about gradable adjectives useful for analyzing source code?

One pattern that jumps out of the plot is that variability, between people, increases as the magnitude specified by the adjective increases (the x-axis shows standard deviations from the mean response). Perhaps the x-axis should use a log scale, there are lots of human related response characteristics that are linear on a log scale (I’m using the same scale as the authors of the study; the authors were a lot more aggressive in removing outliers than I have been), e.g., response to loudness of sound and Hick’s law.

At the moment, it looks as if my estimate of the value of a “small x” is going to be relatively closer to another developers “small x“, than our relative estimated value for a “huge x“.