Derek Jones from The Shape of Code
The ability to perform simple numeric operations can improve the fitness of a creature (e.g., being able to select which branch contains the most fruit), increasing the likelihood of it having offspring. Studies have found that a wide variety of creatures have a brain subsystem known as the Approximate Number System (ANS).
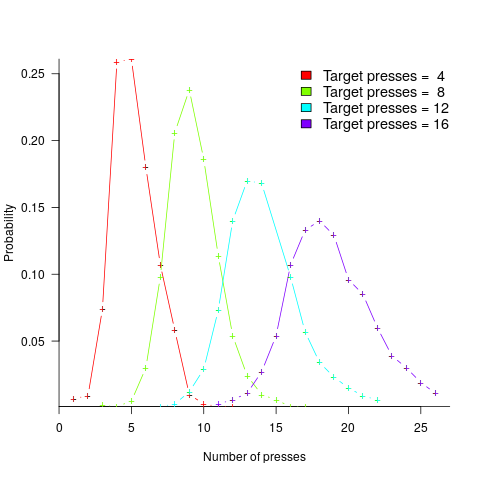
A study by Mechner rewarded rats with food, if they pressed a lever N times (with N taking one of the values 4, 8, 12 or 16), followed by pressing a second lever. The plot below shows the number of lever presses made before pressing the second lever, for a given required N; it suggests that the subject rat is making use of an approximate number system (code+data):
Humans have a second system for representing numbers, which is capable of exact representation, it is language. The Number Sense by Stanislas Dehaene was on my list of Christmas books for 2011.
One method used to study the interface between the two language systems, available to humans, involves subjects estimating the number of dots in a briefly presented image. While reading about one such study, I noticed that some of the plots showed patterns similar to the patterns seen in plots of software estimate/actual data. I emailed the lead author, Véronique Izard, who kindly sent me a copy of the experimental data.
The patterns I was hoping to see are those invariably seen in software effort estimation data, e.g., a power law relationship between actual/estimate, consistent over/under estimation by individuals, and frequent use of round numbers.
Psychologists reading this post may be under the impression that estimating the time taken to implement some functionality, in software, is a relatively accurate process. In practice, for short tasks (i.e., under a day or two) the time needed to form a more accurate estimate makes a good-enough estimate a cost-effective option.
This Izard and Dehaene study involved two experiments. In the first experiment, an image containing between 1 and 100 dots was flashed on the screen for 100ms, and subjects then had to type the estimated number of dots. Each of the six subjects participated in five sessions of 600 trials, with each session lasting about one hour; every number of dots between 1 and 100 was seen 30 times by each subject (for one subject the data contains 1,783 responses, other subjects gave 3,000 responses). Subjects were free to type any value as their estimate.
These kinds of studies have consistently found that subject accuracy is very poor (hardly surprising, given that subjects are not provided with any feedback to help calibrate their estimates). But since researchers are interested in patterns that might be present in the errors, very low accuracy is not an issue.
The plot below shows stimulus (number of dots shown) against subject response, with green line showing  , and red line a fitted regression model having the form
  (which explains just over 70% of the variance; code+data):
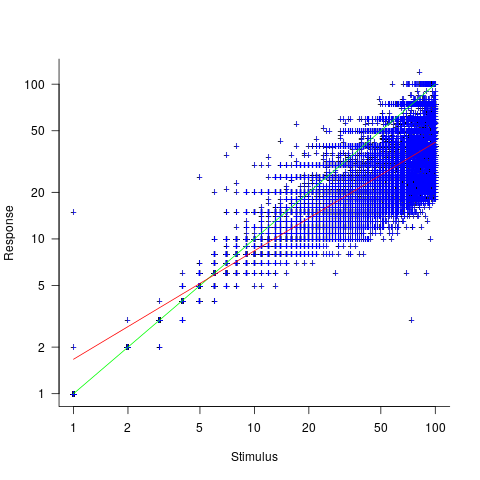
Just like software estimates, there is a good fit to a power law, and the only difference in accuracy performance is that software estimates tend not to be so skewed towards underestimating (i.e., there are a lot more low accuracy overestimates).
Adding subjectID to the model gives:  , with
  varying between 0.65 and 1.57; more than a factor of two difference between subjects (this model explains just under 90% of the variance). This is a smaller range than the software estimation data, but with only six subjects there was less chance of a wider variation (code+data).
The software estimation data finds shows that accuracy does not improve with practice. The experimental subjects were not given any feedback, and would not be expected to improve, but does the strain of answering so many questions cause them to get worse? Adding trial number to the model suggests a 12% increase in underestimation, over 600 trials. However, adding an interaction with SubjectID shows that the performance of two subjects remains unchanged, while two subjects experience a 23% increase in underestimation.
The plot below shows the number of times each response was given, combining all subjects, with commonly given responses in red (code+data):
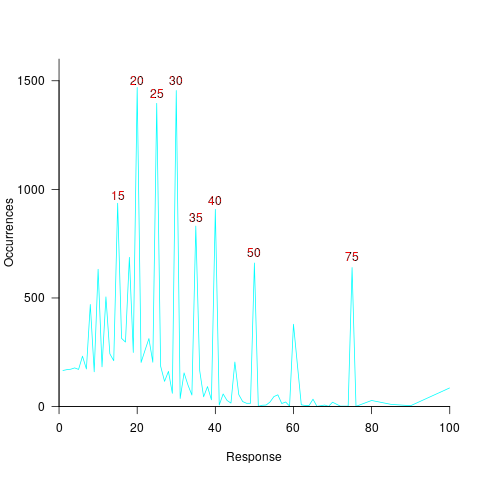
The commonly occurring values that appear in software estimation data are structured as fractions of units of time, e.g., 0.5 hours, or 1 hour or 1 day (appearing in the data as 7 hours). The only structure available to experimental subjects was subdivisions of powers of 10 (i.e., 10 and 100).
Analysing the responses by subject shows that each subject had their own set of preferred round numbers.
To summarize: The results from an experiment investigating the interface between the two human number systems contains three patterns seen in software estimation data, i.e., power law relationship between actual and estimate, individual differences in over/underestimating, and extensive use of round numbers.
Izard’s second experiment limited response values to prespecified values (i.e., one to 10 and multiples of 10), and gave a calibration example after each block of 46 trials. The calibration example improved performance, and the use of round numbers as prespecified response values had the effect of removing spikes from the response counts (which were relatively smooth; code+data)).
We now have circumstantial evidence that software developers are using the Approximate Number System when making software estimates. We will have to wait for brain images from a developer in an MRI scanner, while estimating a software task, to obtain more concrete proof that the ANS is involved in the process. That is, are the areas of the brain thought to be involved in the ANS (e.g., the intraparietal sulcus) active during software estimation?