Derek Jones from The Shape of Code
These days a language’s ecosystem of add-ons, such as packages, is often more important than the features provided by the language (which usually only vary in their syntactic sugar, and built-in support for some subset of commonly occurring features).
Use of a particular language grows and shrinks, sometimes over very many decades. Estimating the number of users of a language is difficult, but a possible proxy is ecosystem activity in the form of package growth/decline. However, it will take many several decades for the data needed to test how effective this proxy might be.
Where are we today?
The Module Counts website is the home for a project that counts the number of libraries/packages/modules contained in 26 language specific repositories. Daily data, in some cases going back to 2010, is available as a csv  The following are the most interesting items I discovered during a fishing expedition.
The csv file contains totals, and some values are missing (which means specifying an ‘ignore missing values’ argument to some functions). Some repos have been experiencing large average daily growth (e.g., 65 for PyPI, and 112 for Maven Central-Java), while others are more subdued (e.g., 0.7 for PERL and 3.9 for R’s CRAN). Apart from a few days, the daily change is positive.
Is the difference in the order of magnitude growth due to number of active users, number of packages that currently exist, a wide/narrow application domain (Python is wide, while R’s is narrow), the ease of getting a package accepted, or something else?
The plots below show how PyPI has been experiencing exponential growth of a kind (the regression model fitted to the daily total has the form  , where
  is the number of days since 2010-01-01; the red line is the daily diff of this equation), while Ruby has been experiencing a linear decline since late 2014 (all code+data):

Will the five-year decline in new submissions to Rubygems continue, and does this point to an eventual demise of Ruby (a few decades from now)? Rubygems has years to go before it reaches PERL’s low growth rate (I think PERL is in terminal decline).
Are there any short term patterns, say at the weekly level? Autocorrelation is a technique for estimating the extent to which today’s value is affected by values from the immediate past (usually one or two measurement periods back, i.e., yesterday or the day before that). The two plots below show the autocorrelation for daily changes, with lag in days:
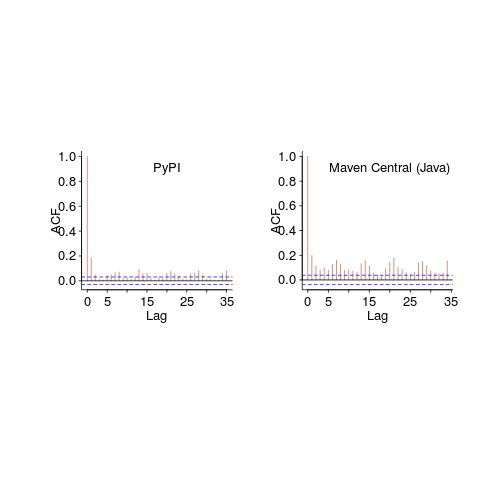
The recurring 7-day ‘peaks’ show the impact of weekends (I assume). Is the larger ”weekend-effect’ for Java, compared to PyPI, due to Java usage including a greater percentage of commercial developers (who tend not to work at the weekend)?
I did not manage to find any seasonal effect, e.g., more submissions during the winter than the summer. But I only checked a few of the languages, and only for a single peak (see code for details).
Another way of tracking package evolution is version numbering. For instance, how often do version numbers change, and which component, e.g., major/minor. There have been a couple of studies looking at particular repos over a few years, but nobody is yet recording broad coverage daily, over the long term 