Derek Jones from The Shape of Code
When reading code, starting at the first line of a function/method, the probability of the next statement read being a for-loop is around 1.5% (at least in C, I don’t have decent data on other languages). Let’s say you have been reading the code a line at a time, and you are now reading lines nested within various if/while/for statements, you are at nesting depth  . What is the probability of the statement on the next line being a
 for-loop?
Does the probability of encountering a for-loop remain unchanged with nesting depth (i.e., developer habits are not affected by nesting depth), or does it decrease (aren’t developers supposed to using functions/methods rather than nesting; I have never heard anybody suggest that it increases)?
If you think the for-loop use probability is not affected by nesting depth, you are going to argue for the plot on the left (below, showing number of loops appearing in C source at various nesting depths), with the regression model fitting really well after 3-levels of nesting. If you think the probability decreases with nesting depth, you are likely to argue for the plot on the right, with the model fitting really well down to around 10-levels of nesting (code+data).
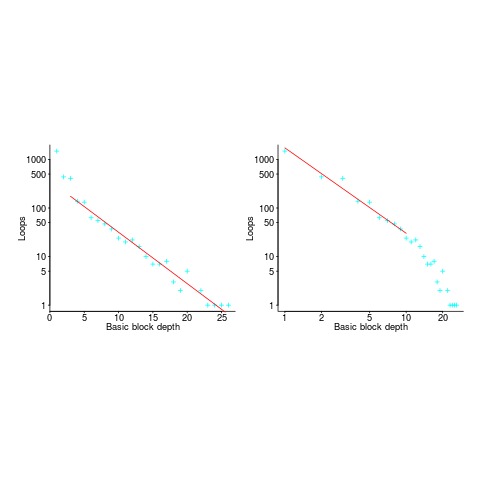
Both plots use the same data, but different scales are used for the x-axis.
If probability of use is independent of nesting depth, an exponential equation should fit the data (i.e., the left plot), decreasing probability is supported by a power-law (i.e, the right plot; plus other forms of equation, but let’s keep things simple).
The two cases are very wrong over different ranges of the data. What is your explanation for reality failing to follow your beliefs in for-loop occurrence probability?
Is the mismatch between belief and reality caused by the small size of the data set (a few million lines were measured, which was once considered to be a lot), or perhaps your beliefs are based on other languages which will behave as claimed (appropriate measurements on other languages most welcome).
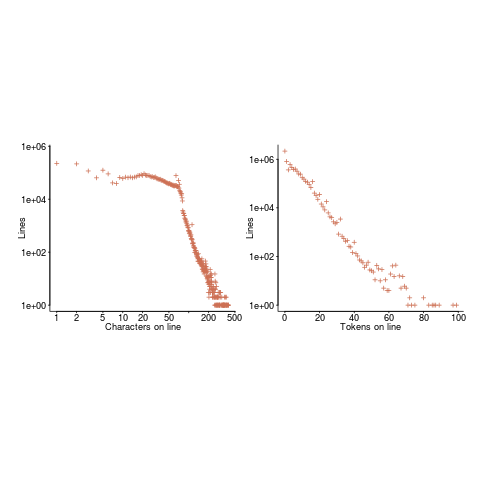
The nesting depth dependent use probability plot shows a sudden change in the rate of decrease in for-loop probability; perhaps this is caused by the maximum number of characters that can appear on a typical editor line (within a window). The left plot (below) shows the number of lines (of C source) containing a given number of characters; the right plot counts tokens per line and the length effect is much less pronounced (perhaps developers use shorter identifiers in nested code). Note: different scales used for the x-axis (code+data).
I don’t have any believable ideas for why the exponential fit only works if the first few nesting depths are ignored. What could be so special about early nesting depths?
What about fitting the data with other equations?
A bi-exponential springs to mind, with one exponential driven by application requirements and the other by algorithm selection; but reality is not on-board with this idea.
Ideas, suggestions, and data for other languages, most welcome.