Derek Jones from The Shape of Code
Software that is used evolves. How fast does software evolve, e.g., much new functionality is added and how much existing functionality is updated?
A new software release is often accompanied by a changelog which lists new, changed and deleted functionality. When software is developed using a continuous release process, the changelog can be very fine-grained.
The changelog for the Beeminder app contains 3,829 entries, almost one per day since February 2011 (around 180 entries are not present in the log I downloaded, whose last entry is numbered 4012).
Is it possible to use the information contained in the Beeminder changelog to estimate the rate of growth of functionality of Beeminder over time?
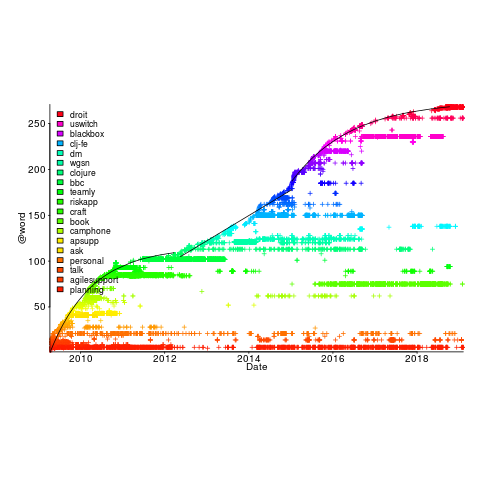
My thinking is driven by patterns in a plot of the Renzo Pomodoro dataset. Renzo assigned a tag-name (sometimes two) to each task, which classified the work involved, e.g., @planning. The following plot shows the date of use of each tag-name, over time (ordered vertically by first use). The first and third black lines are fitted regression models of the form  , where:
  is a constant and
  is the number of days since the start of the interval fitted; the second (middle) black line is a fitted straight line.
How might a changelog line describing a day’s change be distilled to a much shorter description (effectively a tag-name), with very similar changes mapping to the same description?
Named-entity recognition seemed like a good place to start my search, and my natural language text processing tool of choice is still spaCy (which continues to get better and better).
spaCy is Python based and the processing pipeline could have all been written in Python. However, I’m much more fluent in awk for data processing, and R for plotting, so Python was just used for the language processing.
The following shows some Beeminder changelog lines after stripping out urls and formatting characters:
Cheapo bug fix for erroneous quoting of number of safety buffer days for weight loss graphs.
Bugfix: Response emails were accidentally off the past couple days; fixed now. Thanks to user bmndr.com/laur  for alerting us!
More useful subject lines in the response emails, like "wrong lane!" or whatnot.
Clearer/conciser stats at bottom of graph pages. (Will take effect when you enter your next datapoint.) Progress, rate, lane, delta.
Better handling of significant digits when displaying numbers. Cf stackoverflow.com/q/5208663
The code to extract and print the named-entities in each changelog line could not be simpler.
import spacy
import sys

nlp = spacy.load("en_core_web_sm") # load trained English pipelines

count=0

for line in sys.stdin:
   count += 1
   print(f'> {count}: {line}')
#
   doc=nlp(line) # do the heavy lifting
#
   for ent in doc.ents:  # iterate over detected named-entities
      print(ent.lemma_, ent.label_)
To maximize the similarity between named-entities appearing on different lines the lemmas are printed, rather than original text (i.e., words appear in their base form).
The label_ specifies the kind of named-entity, e.g., person, organization, location, etc.
This code produced 2,225 unique named-entities (5,302 in total) from the Beeminder changelog (around 0.6 per day), and failed to return a named-entity for 33% of lines. I was somewhat optimistically hoping for a few hundred unique named-entities.
There are several problems with this simple implementation:
- each line is considered in isolation,
- the change log sometimes contains different names for the same entity, e.g., a person’s full name, Christian name, or twitter name,
- what appear to be uninteresting named-entities, e.g., numbers and dates,
- the language does not know much about software, having been training on a corpus of general English.
Handling multiple names for the same entity would a lot of work (i.e., I did nothing), ‘uninteresting’ named-entities can be handled by post-processing the output.
A language processing pipeline that is not software-concept aware is of limited value. spaCy supports adding new training models, all I need is a named-entity model trained on manually annotated software engineering text.
The only decent NER training data I could find (trained on StackOverflow) was for BERT (another language processing tool), and the data format is very different. Existing add-on spaCy models included fashion, food and drugs, but no software engineering.
Time to roll up my sleeves and create a software engineering model. Luckily, I found a webpage that provided a good user interface to tagging sentences and generated the json file used for training. I was patient enough to tag 200 lines with what I considered to be software specific named-entities. … and now I have broken the NER model I built…
The following plot shows the growth in the total number of named-entities appearing in the changelog, and the number of unique named-entities (with the 1,996 numbers and dates removed; code+data);
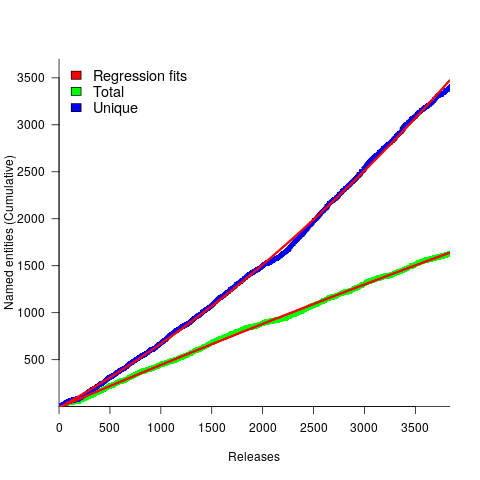
The regression fits (red lines) are quadratics, slightly curving up (total) and down (unique); the linear growth components are: 0.6 per release for total, and 0.46 for unique.
Including software named-entities is likely to increase the total by at least 15%, but would have little impact on the number of unique entries.
This extraction pipeline processes one release line at a time. Building a set of Beeminder tag-names requires analysing the changelog as a whole, which would take a lot longer than the day spent on this analysis.
The Beeminder developers have consistently added new named-entities to the changelog over more than eleven years, but does this mean that more features have been consistently added to the software (or are they just inventing different names for similar functionality)?
It is not possible to answer this question without access to the code, or experience of using the product over these eleven years.
However, staying in business for eleven years is a good indicator that the developers are doing something right.
