Derek Jones from The Shape of Code
Two things need to occur for a user to experience a fault in a program:
- a fault has to exist in the code,
- the user has to provide input that causes program execution to include the faulty code in a way that exhibits the incorrect behavior.
Data on the distribution of user input values is extremely rare, and we are left having to look for the shadows that the input distribution creates.
Csmith is a well-known tool for generating random C source code. I spotted an interesting plot in a compiler fuzzing paper and Yang Chen kindly sent me a copy of the data. In compiler fuzzing, source code is automatically generated and fed to the compiler, various techniques are used to figure out when the compiler gets things wrong.
The plot below is a count of the number of times each fault in gcc has been triggered (code+data). Multiple occurrences of the same fault are experienced because the necessary input values occur multiple times in the generated source code (usually in different files).
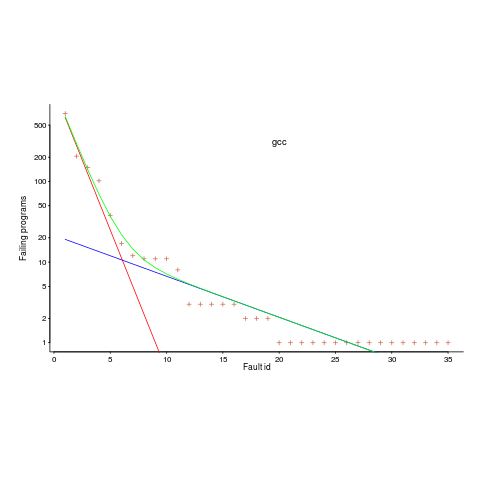
The green line is a fitted regression model, it’s a bi-exponential, i.e., the sum of two exponentials (the straight lines in red and blue).
The obvious explanation for this bi-exponential behavior (explanations invented after seeing the data can have the flavor of just-so stories, which is patently not true here  is that one exponential is driven by the presence of faults in the code and the other exponential is driven by the way in which Csmith meanders over the possible C source.
So, which exponential is generated by the faults and which by Csmith? I’m still trying to figure this out; suggestions welcome, along with alternative explanations.
Is the same pattern seen in duplicates of user reported faults? It does in the small amount of data I have; more data welcome.