Derek Jones from The Shape of Code
Software developers are employed by organizations and people change jobs, either voluntarily or not; every year a new batch of people join the workforce, e.g., new graduates. Governments track employment activities for a variety of reasons, e.g., tax collection, and monitoring labour supply and demand (for the purposes of planning).
The US Bureau of Labor Statistics’ publishes a monthly summary of their Job Openings and Labor Turnover Survey. What can be learned about software development employment from this data (description)?
The data starts in December 2000, with each row contains a monthly count of Job Openings, Hires, Quits, Layoffs and Discharges, and totals, along with one of 21 major non-farm industry codes or one of the 5 government codes (the counts are broken out by State). I’m guessing that software developers are assigned the Information code (i.e., 510000), but who is to say that some have not been classified with the code for, say, Construction or Education and health services. The Information code will cover a lot more than just software developers; I’m trading off broad IT coverage for monthly details on employment turnover (software developer specific information is available, but it comes without the turnover information). The Bureau of Labor Statistics make available a huge quantity of information, and understanding how it all fits together would probably require me to spend several months learning my way around (I have already spent a week or two over the years), so I’m sticking with a prebuilt dataset.
The plot below shows the aggregated monthly counts (i.e., all states) of Job Openings, Hires, Quits, Layoffs and Discharges for the Information industry code (code+data):
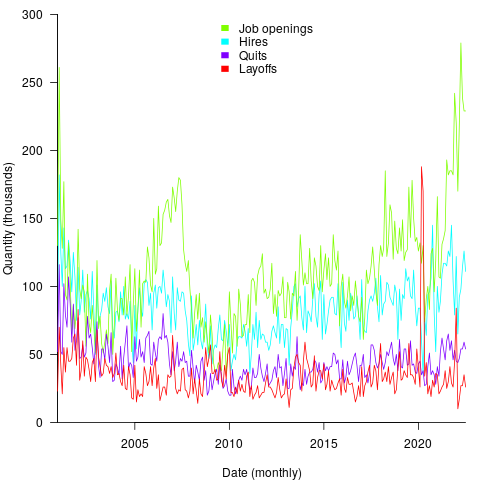
The general trend follows the ups and downs of the economy, there is a huge spike in layoffs in early 2020 (the start of COVID), and Job Openings often exceeding Hires (which I did not expect).
These counts have the form of a time-series, which leads to the questions about repeating patterns in the sequence of values? The plot below shows the autocorrelation of the four employment counts (code+data):
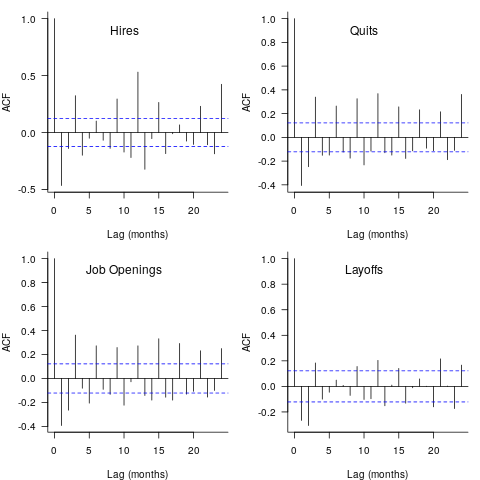
The spike in Hires at 12-months is too large to be just be new graduates entering the workforce; perhaps large IT employers have annual reviews for all employees at the same time every year, causing some people to quit and obtain new jobs (Quits has a slightly larger spike at 12-months). Why is there a regular 3-month cycle for Job Openings? The negative correlation in Layoffs at one & two months is explained by companies laying off a batch of workers one month, followed by layoffs in the following two months being lower than usual.
I don’t know much about employment practices, so I won’t speculate any more. Comments welcome.
Are there any interest cross-correlations between the pairs of time-series?
The plot below shows four pairs of cross correlations (code+data):
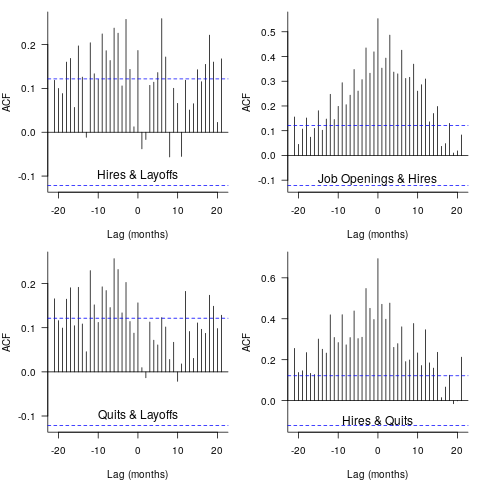
Hires & Layoffs shows a scattered pattern of Hires preceding Layoffs (to be expected), and the bottom left shows there is a pattern of Quits preceding Layoffs (are people searching for steadier employment when layoffs loom?). Top right shows a pattern of Job Openings following Hires (I’m clutching at straws for this; is Hires a proxy for Quits, the cross correlation of Job Openings & Quits does have Job Openings leading), the bottom right shows the pattern of Hires leading Quits.
Nothing in this analysis surprised me, but then it is rather basic and broad brush. These results are the start of an analysis of the IT employment ecosystem; one that probably won’t progress far because of a lack of data and interest on my part.
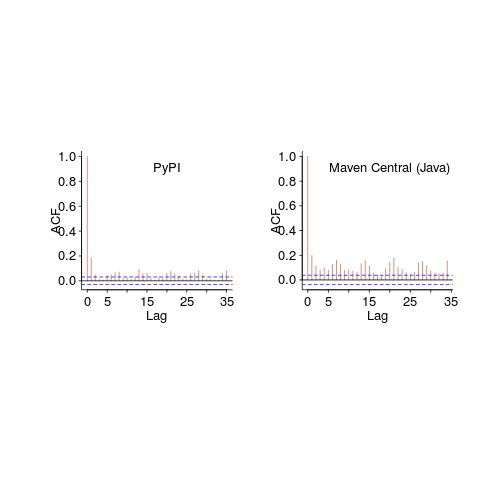
 The following are the most interesting items I discovered during a fishing expedition.
 , where
  is the number of days since 2010-01-01; the red line is the daily diff of this equation), while Ruby has been experiencing a linear decline since late 2014 (all