Derek Jones from The Shape of Code
Circular statistics deals with analysis of measurements made using a circular scale, e.g., minutes past the hour, days of the week. Wikipedia uses the term directional statistics, the traditional use being measurements of angles, e.g., wind direction.
Package support for circular statistics is rather thin on the ground. R’s circular package is one of the best, and the book “Circular Statistics in R” provides the only best introduction to the subject.
Circular statistics has a few surprises for those new to the subject (apart from a few name changes, e.g., the von Mises distribution is effectively the ‘circular Normal distribution’), including:
- the mean value contains two components, a direction and a length, e.g., mean wind direction and strength,
- there are several definitions of variance, with angular variance having a value between 0 and 2, and circular variance having a value between 0 and 1. The circular standard deviation is not the square root of variance, but rather:
 , where
  is the mean length.
The basic techniques used in circular statistics are still relatively new, compared to the more well known basic statistical techniques. For instance, it was recently discovered that having more measurements may reduce the reliability of the Rao spacing test (used to test whether a sample has a uniform circular distribution); generally, having more measurements improves the reliability of a statistical test.
The plot below shows Rose diagrams for the number of commits in each 3-hour period of a day for Linux and FreeBSD (mean direction and length in green; code+data):
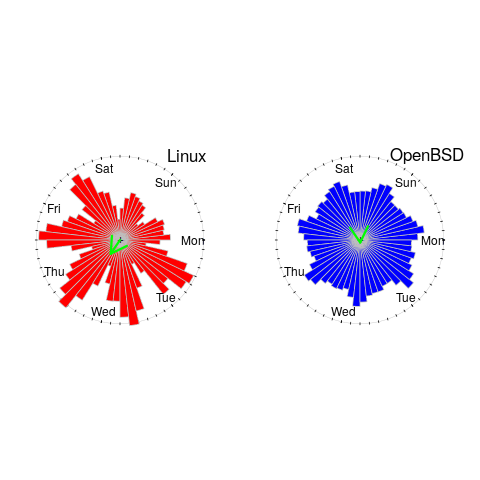
The Linux kernel source has far fewer commits at the weekend, compared to working days. Given the number of people whose job is to work on the Linux kernel, compared to the number of people doing it out of interest, this difference is not surprising. The percentage of people working on OpenBSD as a job is small, and there does not appear to be a big difference between weekends and workdays. There is a lot of variation in the number of commits during each 3-hour period of a day, but the number of commits per day does not vary so much; the number of OpenBSD commits per day of week is:
            Mon   Tue   Wed   Thu   Fri   Sat   Sun
          26909 26144 25705 25104 24765 22812 24304
Does this distribution of commits per day have a uniform distribution (to some confidence level)?
Like all measurements, those made on a circular scale are rounded to some number of digits. Measurements may also be rounded, or binned, to particular units of the scale, e.g., measured to the nearest degree, or nearest minute.
A recent paper, by Landler, Ruxton and Malkemper, found that for samples containing around five hundred or more measurements, rounding to the nearest degree was sufficient to cause the Rao spacing test to almost always report non-uniformity, i.e., for non-trivial samples the rounding was sufficient to cause the test to detect non-uniformity (things worked as expected for samples containing fewer than 100 measurements).
Landler et al found that adding a small amount of noise (drawn from a von Mises distribution) to the rounded measurements appeared to ‘fix’ the incorrect behavior, i.e., rejecting the hypothesis of a uniform distribution, when a uniform distribution may be present.
The rao.spacing.test function, in the circular package, rejected that null hypothesis that the OpenBSD daily data has a uniform distribution. However, when noise is added to each day value (i.e., adding a random fraction to the day values, using rvonmises(length(c_per_day), circular(0), 2.0)), the call to rao.spacing.test failed to reject the null hypothesis of uniformity at the 0.05 level (i.e., the daily distribution is probably uniform).
How many research results are affected by this discovery?
I very rarely encounter the use of circular statistics (even though they should probably have been used in places), but then I spend my time reading software engineering papers, whose use of statistics tends to be primitive. I plan to include a brief mention of the use of the Rao spacing test with binned data in the addendum to my Evidence-based software engineering book (which includes the above example).
 , where
  is the mean length.