Derek Jones from The Shape of Code
As its name suggests, extreme value theory deals with extreme deviations from the average, e.g., how often will rainfall be heavy enough to cause a river to overflow its banks.
The initial list of statistical topics to I thought ought to be covered in my evidence-based software engineering book included extreme value theory. At the time, and even today, there were/are no books covering “Statistics for software engineering”, so I had no prior work to guide my selection of topics. I was keen to cover all the important topics, had heard of it in several (non-software) contexts and jumped to the conclusion that it must be applicable to software engineering.
Years pass: the draft accumulate a wide variety of analysis techniques applied to software engineering data, but, no use of extreme value theory.
Something else does not happen: I don’t find any ‘Using extreme value theory to analyse data’ books. Yes, there are some really heavy-duty maths books available, but nothing of a practical persuasion.
The book’s Extreme value section becomes a subsection, then a subsubsection, and ended up inside a comment (I cannot bring myself to delete it).
It appears that extreme value theory is more talked about than used. I can understand why. Extreme events are newsworthy; rivers that don’t overflow their banks are not news.
Just over a month ago a discussion cropped up on the UK’s C++ standards’ panel mailing list: was email traffic down because of COVID-19? The panel’s convenor, Roger Orr, posted some data on monthly volumes. Oh, data 
Monthly data is a bit too granular for detailed analysis over relatively short periods. After some poking around Roger was able to send me the date&time of every post to the WG21‘s Core and Lib reflectors, since February 2016 (there have been various changes of hosts and configurations over the years, and date of posts since 2016 was straightforward to obtain).
During our email exchanges, Roger had mentioned that every now and again a huge discussion thread comes out of nowhere. Woah, sounds like WG21 could do with some extreme value theory. How often are huge discussion threads likely to occur, and how huge is a once in 10-years thread that they might have to deal with?
There are two techniques for analysing the distribution of extreme values present in a sample (both based around the generalized extreme value distribution):
- Generalized Extreme Value (GEV) uses block maxima, e.g., maximum number of daily emails sent in each month,
- Generalized Pareto (GP) uses peak over threshold: pick a threshold and extract day values for when more than this threshold number of emails was sent.
The plots below show the maximum number of monthly emails that are expected to occur (y-axis) within a given number of months (x-axis), for WG21’s Core and Lib email lists. The circles are actual occurrences, and dashed lines 95% confidence intervals; GEP was used for these fits (code+data):
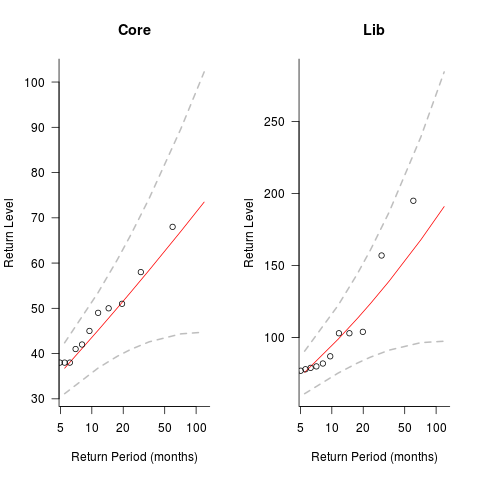
The 10-year return value for Core is around a daily maximum of 70 +-30, and closer to 200 +-100 for Lib.
The model used is very simplistic, and fails to take into account the growth in members joining these lists and traffic lost when a new mailing list is created for a new committee subgroup.
If any readers have suggests for uses of extreme value theory in software engineering, please let me know.
Postlude. This discussion has reordered events. My original interest in the mailing list data was the desire to find some evidence for the hypothesis that the volume of email increased as the date of the next WG21 meeting approached. For both Core and Lib, the volume actually decreases slightly as the date of the next meeting approaches; see code for details. Also, the volume of email at the weekend is around 60% lower than during weekdays.