Derek Jones from The Shape of Code
How much influence do anchoring and financial incentives have on estimation accuracy?
Anchoring is a cognitive bias which occurs when a decision is influenced by irrelevant information. For instance, a study by John Horton asked 196 subjects to estimate the number of dots in a displayed image, but before providing their estimate subjects had to specify whether they thought the number of dots was higher/lower than a number also displayed on-screen (this was randomly generated for each subject).
How many dots do you estimate appear in the plot below?

Estimates are often round numbers, and 46% of dot estimates had the form of a round number. The plot below shows the anchor value seen by each subject and their corresponding estimate of the number of dots (the image always contained five hundred dots, like the one above), with round number estimates in same color rows (e.g., 250, 300, 500, 600; code+data):
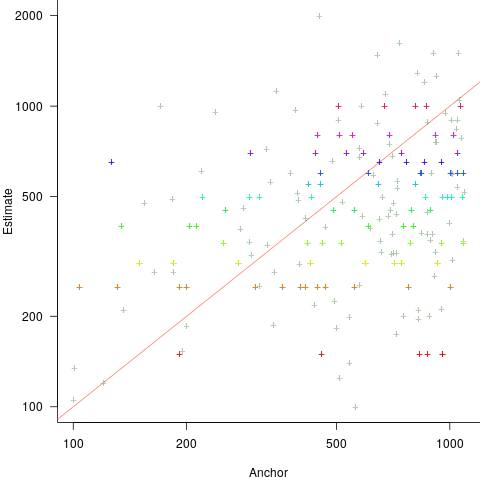
How much influence does the anchor value have on the estimated number of dots?
One way of measuring the anchor’s influence is to model the estimate based on the anchor value. The fitted regression equation  explains 11% of the variance in the data. If the higher/lower choice is included the model, 44% of the variance is explained; higher equation is:
  and lower equation is:
  (a multiplicative model has a similar goodness of fit), i.e., the anchor has three-times the impact when it is thought to be an underestimate.
How much would estimation accuracy improve if subjects’ were given the option of being rewarded for more accurate answers, and no anchor is present?
A second experiment offered subjects the choice of either an unconditional payment of $2.50 or a payment of $5.00 if their answer was in the top 50% of estimates made (labelled as the risk condition).
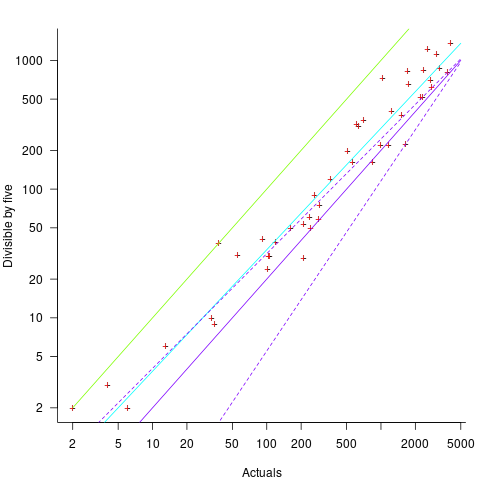
The 196 subjects saw up to seven images (65 only saw one), with the number of dots varying from 310 to 8,200. The plot below shows actual number of dots against estimated dots, for all subjects; blue/green line shows  , and red line shows the fitted regression model
  (code+data):
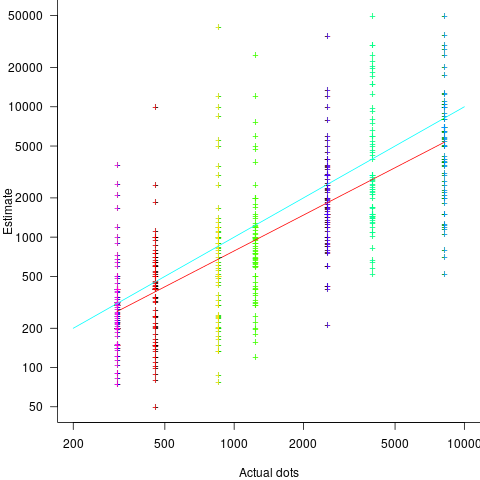
The variance in the estimated number of dots is very high and increases with increasing actual dot count, however, this behavior is consistent with the increasing variance seen for images containing under 100 dots.
Estimates were not more accurate in those cases where subjects chose the risk payment option. This is not surprising, performance improvements require feedback, and subjects were not given any feedback on the accuracy of their estimates.
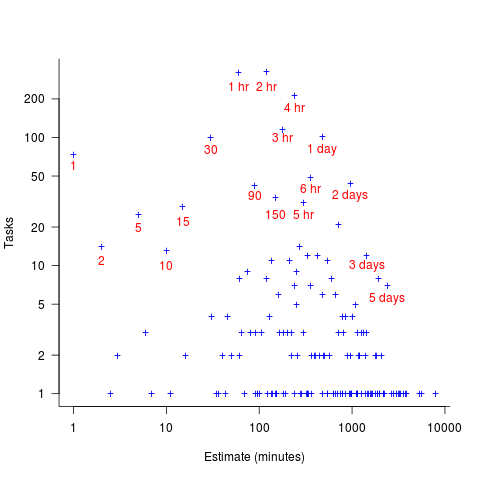
Of the 86 subjects estimating dots in three or more images, 44% always estimated low and 16% always high. Subjects always estimating low/high also occurs in software task estimates.
Estimation patterns previously discussed on this blog have involved estimated values below 100. This post has investigated patterns in estimates ranging from several hundred to several thousand. Patterns seen include extensive use of round numbers and increasing estimate variance with increasing actual value; all seen in previous posts.
 , and red line a fitted regression model having the form
  (which explains just over 70% of the variance;
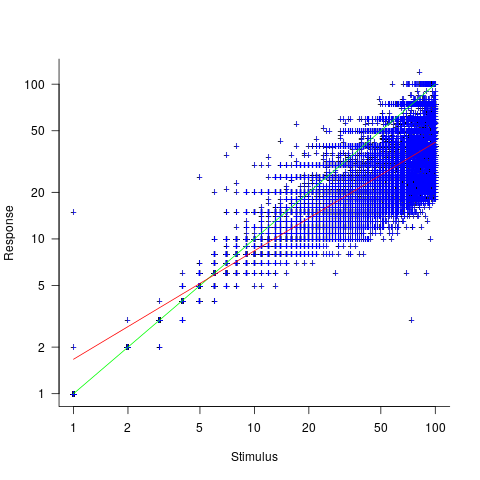
 , with
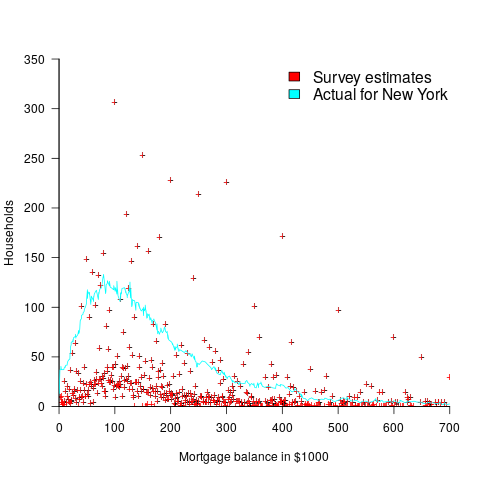
  varying between 0.65 and 1.57; more than a factor of two difference between subjects (this model explains just under 90% of the variance). This is a smaller range than the software estimation data, but with only six subjects there was less chance of a wider variation (
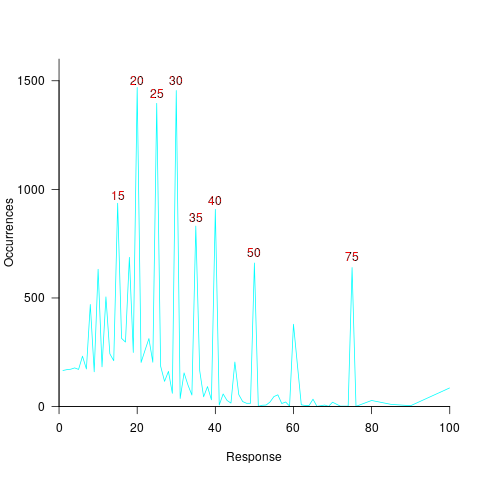


 ) (
) (
 ) (
) (
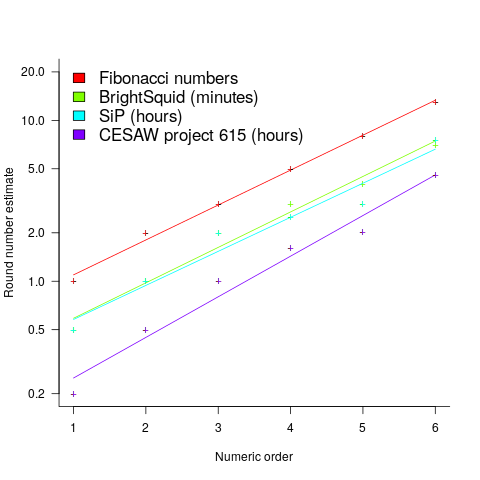
 (there is a small variation in the value of the constant; the smallest value for project 615 was probably calculated rather than being human selected).
 . I await the data needed to answer this question.
 (there is a small variation in the value of the constant; the smallest value for project 615 was probably calculated rather than being human selected).
 . I await the data needed to answer this question.