Derek Jones from The Shape of Code
The use of adjectives to analysis source code is something of a specialist topic. This post can only increase the number of people using adjectives for this purpose (because I don’t know anybody else who does 
Until recently the only adjective related property I used to help analyse source was relative order. When using multiple adjective, people have a preferred order, e.g., in English size comes before color, as in “big red” (“red big” sounds wrong), and adjectives always appear before the noun they modify. Native speakers of different languages have various preferred orders. Source code may appear to only contain English words, but adjective order can provide a clue about the native language of the developer who wrote it, because native ordering leaks into English usage.
Searching for adjective patterns (or any other part-of-speech pattern) in identifiers used to be complicated (identifiers first had to be split into their subcomponents). Now, thanks to Vadim Markovtsev, 49 million token-split identifiers are available. Happy adjective pattern matching (Size Shape Age Color is a common order to start with; adjective pairs are found in around 0.1% of identifiers; some scripts).
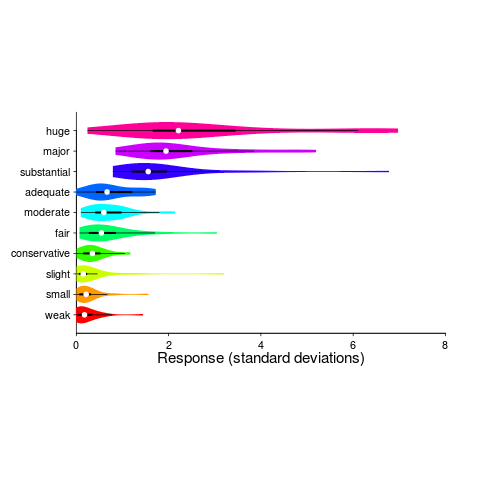
Until recently, gradable adjectives were something that I had been vaguely aware of; these kinds of adjectives indicate a position on a scale, e.g., hot/warm/cold water. The study Grounding Gradable Adjectives through Crowdsourcing included some interesting data on the perceived change of an attribute produced by the presence by a gradable adjective. The following plot shows perceived change in quantity produced by some quantity adjectives (code+data):
How is information about gradable adjectives useful for analyzing source code?
One pattern that jumps out of the plot is that variability, between people, increases as the magnitude specified by the adjective increases (the x-axis shows standard deviations from the mean response). Perhaps the x-axis should use a log scale, there are lots of human related response characteristics that are linear on a log scale (I’m using the same scale as the authors of the study; the authors were a lot more aggressive in removing outliers than I have been), e.g., response to loudness of sound and Hick’s law.
At the moment, it looks as if my estimate of the value of a “small x” is going to be relatively closer to another developers “small x“, than our relative estimated value for a “huge x“.