Parkinson’s law, striving to meet a deadline, or happenstance?

Derek Jones from The Shape of Code

How many minutes past the hour was it, when you stopped working on some software related task?

There are sixty minutes in an hour, so if stop times are random, the probability of finishing at any given minute is 1-in-60. If practice (based on the 200k+ time records in the CESAW dataset) the probability of stopping on the hour is 1-in-40, and for stopping on the half-hour is 1-in-48.

Why are developers more likely to stop working on a task, on the hour or half-hour?

Is this a case of Parkinson’s law, or are developers striving to complete a task within a specified time, or are they stopping because a scheduled activity takes priority?

The plot below shows the number of times (y-axis) work on a task stopped on a given minute past the hour (x-axis), for 16 different software projects (project number in blue, with top 10 numbers in red, code+data):

Number of times work on a task stopped at a given minute of the hour, for 16 projects.

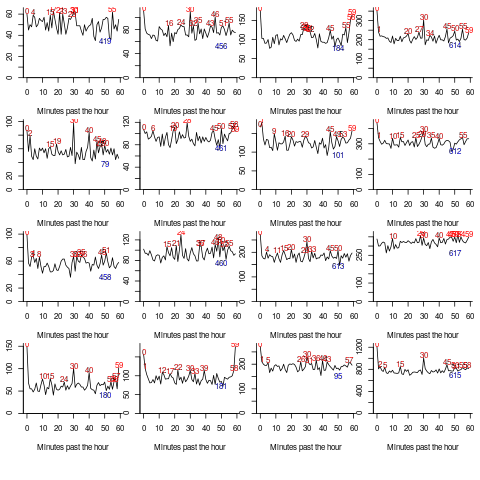
Some projects have peaks at 50, 55, or thereabouts. Perhaps people are stopping because they have a meeting to attend, and a peak is visible because the project had lots of meetings, or no peak was visible because the project had few meetings. Some projects have a peak at 28 or 29, which might be some kind of time synchronization issue.

Is it possible to analyze the distribution of end minutes to reasonably infer developer project behavior, e.g., Parkinson’s law, striving to finish by a given time, or just not watching the clock?

An expected distribution pattern for both Parkinson’s law, and striving to complete, is a sharp decline of work stops after a reference time, e.g., end of an hour (this pattern is present in around ten of the projects plotted). A sharp increase in work stops prior to a reference time could also apply for both behaviors; stopping to switch to other work adds ‘noise’ to the distribution.

The CESAW data is organized by project, not developer, i.e., it does not list everything a developer did during the day. It is possible that end-of-hour work stops are driven by the need to synchronize with non-project activities, i.e., no Parkinson’s law or striving to complete.

In practice, some developers may sometimes follow Parkinson’s law, other times strive to complete, and other times not watch the clock. If models capable of separating out the behaviors were available, they might only be viable at the individual level.

Stop time equals start time plus work duration. If people choose a round number for the amount of work time, there is likely to be some correlation between start/end minutes past the hour. The plot below shows heat maps for start fraction of hour (y-axis) against end fraction of hour (x-axis) for four projects (code+data):

Heat map of start/end minute for tasks, for four projects.

Work durations that are exact multiples of an hour appear along the main diagonal, with zero/zero being the most common start/end pair (at 4% over all projects, with 0.02% expected for random start/end times). Other diagonal lines come from work durations that include a fraction of an hour, e.g., 30-minutes and 20-minutes.

For most work periods, the start minute occurs before the end minute, i.e., the work period does not cross an hour boundary.

What can be learned from this analysis?

The main takeaway is that there is a small bias for work start/end times to occur on the hour or half-hour, and other activities (e.g., meetings) cause ongoing work to be interrupted. Not exactly news.

More interesting ideas and suggestions welcome.

Actual implementation times are often round numbers

Derek Jones from The Shape of Code

To what extent do developers consciously influence the time taken to actually complete a task?

If the time estimated to complete a task is rather generous, a developer has the opportunity to follow Parkinson’s law (i.e., “work expands so as to fill the time available for its completion”), or if the time is slightly less than appears to be required, they might work harder to finish within the estimated time (like some marathon runners have a target time)?

The use of round numbers are a prominent pattern seen in task estimation times.

If round numbers appeared more often in the actual task completion time than would be expected by chance, it would suggest that developers are sometimes working to a target time. The following plot shows the number of tasks taking a given amount of actual time to complete, for project 615 in the CESAW dataset (similar patterns are present in the actual times of other projects; code+data):

Number of tasks taking a given amount of time to complete, for project 615.

The red lines are a fitted bi-exponential distribution to the ‘spike’ (i.e., round numbers, circled in grey) and non-spike points (spikes automatically selected, see code for details), green and purple lines are the two components of the non-spike fit.

Tasks are not always started and completed in one continuous work session, work may be spread over multiple work sessions; the CESAW data includes the start/end time of every work session associated with each task (85% of tasks involve more than one work session, for project 615). The following plots are based on work sessions, rather than tasks, for tasks worked on over two (left) and three (right) sessions; colored lines denote session ordering within a task (code+data):

Number of sessions taking a given amount of time to complete, for project 615.

Shorter sessions dominate for the last session of task implementation, and spikes in the counts indicate the use of round numbers in all session positions (e.g., 180 minutes, which may be half a day).

Perhaps round number work session times are a consequence of developers using round number wall-clock times to start and end work sessions. The plot below shows (left) the number of work sessions starting at a given number of minutes past the hour, and (right) the number of work sessions ending at a given number of minutes past the hour; both for project 615 (code+data):

Rose diagrams for minutes past the hour of work session wall clock start (left) and end (right).

The arrow (green) shows the direction of the mean, and the almost invisible interior line shows that the length of the mean is almost zero. The five-minute points have slightly more session starts/ends than the surrounding minute values, but are more like bumps than spikes. The start of the hour, and 30-minutes, have prominent spikes, which might be caused by the start/end of the working day, and start/end of the lunch break.

Five-minutes is a convenient small rounding interval to either expand implementation time, or to target as a completion time. The following plot shows, for each of the 47 individuals working on project 615, the number of actual session times and the number exactly divisible by five. The green line shows the case where every actual is divisible by five, the purple line where 20% are divisible by five (expected for unbiased timing), the dashed purple lines show one standard deviation, the blue/green line is a fitted regression model (0.4*Actual^{0.94 pm 0.04}) (code+data):

Number of sessions against number of sessions whose actual time is divisible by five, for 47 people working on project 615.

It appears that on average, five-minute session times occur twice as often as expected by chance; two individuals round all their actual session times (ok, it’s not that unlikely for the person with just two sessions).

Does it matter that some developers have a preference for using round numbers when recording time worked?

The use of round numbers in the recording of actual work sessions will inflate the total actual time for most tasks (because most tasks involve more than one session, and assuming that most rounding is not caused by developers striving to meet a target). The amount of error introduced is probably a lot less than the time variability caused by other implementation factors (I have yet to do the calculation).

I see the use of round numbers as a means of unpicking developer work habits.

Given the difficulty of getting developers to record anything, requiring them to record to minute-level accuracy appears at best optimistic. Would you work for a manager that required this level of effort detail (I know there is existing practice in other kinds of jobs)?