Growth in FLOPS used to train ML models

Derek Jones from The Shape of Code

AI (a.k.a. machine learning) is a compute intensive activity, with the performance of trained models being dependent on the quantity of compute used to train the model.

Given the ongoing history of continually increasing compute power, what is the maximum compute power that might be available to train ML models in the coming years?

How might the compute resources used to train an ML model be measured?
One obvious answer is to specify the computers used and the numbers of days used they were occupied training the model. The problem with this approach is that the differences between the computers used can be substantial. How is compute power measured in other domains?

Supercomputers are ranked using FLOPS (floating-point operations per second), or GigFLOPS or PetaFLOPS (10^{15}). The Top500 list gives values for R_{max} (based on benchmark performance, i.e., LINNPACK) and R_{peak} (what the hardware is theoretically capable of, which is sometimes more than twice R_{max}).

A ballpark approach to measuring the FLOPS consumed by an application is to estimate the FLOPS consumed by the computers involved and multiply by the number of seconds each computer was involved in training. The huge assumption made with this calculation is that the application actually consumes all the FLOPS that the hardware is capable of supplying. In some cases this appears to be the metric used to estimate the compute resources used to train an ML model. Some published papers just list a FLOPS value, while others list the number of GPUs used (e.g., 2,128).

A few papers attempt a more refined approach. For instance, the paper describing the GPT-3 models derives its FLOPS values from quantities such as the number of parameters in each model and number of training tokens used. Presumably, the research group built a calibration model that provided the information needed to estimate FLOPS in this way.

How does one get to be able to use PetaFLOPS of compute to train a model (training the GPT-3 175B model consumed 3,640 PetaFLOP days, or around a few days on a top 8 supercomputer)?

Pay what it costs. Money buys cloud compute or bespoke supercomputers (which are more cost-effective for large scale tasks, if you have around £100million to spend plus £10million or so for the annual electricity bill). While the amount paid to train a model might have lots of practical value (e.g., can I afford to train such a model), researchers might not be keen to let everybody know how much they spent. For instance, if a research team have a deal with a major cloud provider to soak up any unused capacity, those involved probably have no interest in calculating compute cost.

How has the compute power used to train ML models increased over time? A recent paper includes data on the training of 493 models, of which 129 include estimated FLOPS, and 106 contain date and model parameter data. The data comes from published papers, and there are many thousands of papers that train ML models. The authors used various notability criteria to select papers, and my take on the selection is that it represents the high-end of compute resources used over time (which is what I’m interested in). While they did a great job of extracting data, there is no real analysis (apart from fitting equations).

The plot below shows the FLOPS training budget used/claimed/estimated for ML models described in papers published on given dates; lines are fitted regression models, and the colors are explained below (code+data):

FLOPS consumed training ML models over time.

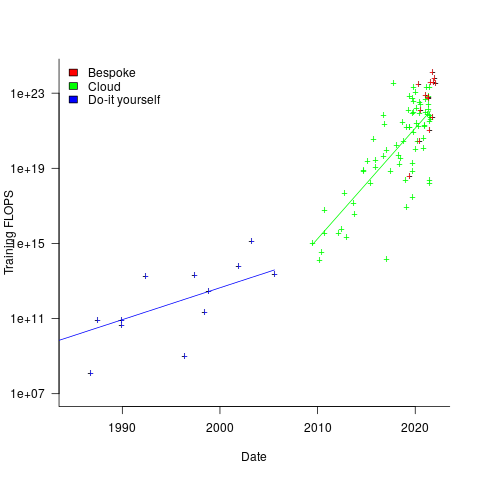
My interpretation of the data is based on the economics of accessing compute resources. I see three periods of development:

  1. do-it yourself (18 data points): During this period most model builders only had access to a university computer, desktop machines, or a compute cluster they had self-built,
  2. cloud (74 data points): Huge on demand compute resources are now just a credit card away. Researchers no longer have to wait for congested university computers to become available, or build their own systems.

    AWS launched in 2006, and the above plot shows a distinct increase in compute resources around 2008.

  3. bespoke (14 data points): if the ML training budget is large enough, it becomes cost-effective to build a bespoke system, e.g., a supercomputer. As well as being more cost-effective, a bespoke system can also be specifically designed to handle the characteristics of the kinds of applications run.

    How might models trained using a bespoke system be distinguished from those trained using cloud compute? The plot below shows the number of parameters in each trained model, over time, and there is a distinct gap between 10^{10} and 10^{11} parameters, which I assume is the result of bespoke systems having the memory capacity to handle more parameters (code+data):

    Number of parameters in ML models over time.

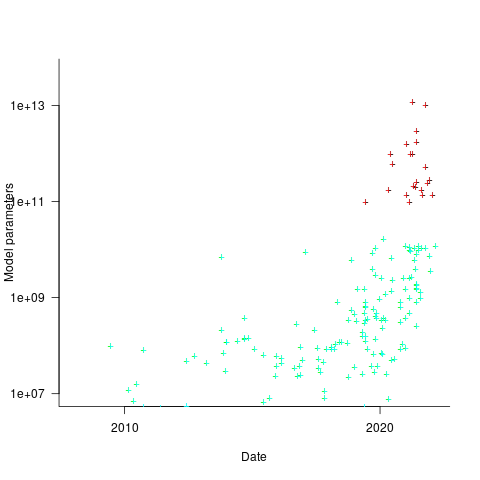
The rise in FLOPS growth rate during the Cloud period comes from several sources: 1) the exponential decline in the prices charged by providers delivers researchers an exponentially increasing compute for the same price, 2) researchers obtaining larger grants to work on what is considered to be an important topic, 3) researchers doing deals with providers to make use of excess capacity.

The rate of growth of Cloud usage is capped by the cost of building a bespoke system. The future growth of Cloud training FLOPS will be constrained by the rate at which the prices charged for a FLOP decreases (grants are unlikely to continually increase substantially).

The rate of growth of the Top500 list is probably a good indicator of the rate of growth of bespoke system performance (and this does appear to be slowing down). Perhaps specialist ML training chips will provide performance that exceeds that of the GPU chips currently being used.

The maximum compute that can be used by an application is set by the reliability of the hardware and the percentage of resources used to recover from hard errors that occur during a calculation. Supercomputer users have been facing the possibility of hitting the wall of maximum compute for over a decade. ML training is still a minnow in the supercomputer world, where calculations run for months, rather than a few days.

Software effort estimation is mostly fake research

Derek Jones from The Shape of Code

Effort estimation is an important component of any project, software or otherwise. While effort estimation is something that everybody in industry is involved with on a regular basis, it is a niche topic in software engineering research. The problem is researcher attitude (e.g., they are unwilling to venture into the wilds of industry), which has stopped them acquiring the estimation data needed to build realistic models. A few intrepid people have risked an assault on their ego and talked to people in industry, the outcome has been, until very recently, a small collection of tiny estimation datasets.

In a research context the term effort estimation is actually a hang over from the 1970s; effort correction more accurately describes the behavior of most models since the 1990s. In the 1970s models took various quantities (e.g., estimated lines of code) and calculated an effort estimate. Later models have included an estimate as input to the model, producing a corrected estimate as output. For the sake of appearances I will use existing terminology.

Which effort estimation datasets do researchers tend to use?

A 2012 review of datasets used for effort estimation using machine learning between 1991-2010, found that the top three were: Desharnias with 24 papers (29%), COCOMO with 19 papers (23%) and ISBSG with 17. A 2019 review of datasets used for effort estimation using machine learning between 1991 and 2017, found the top three to be NASA with 17 papers (23%), the COCOMO data and ISBSG were joint second with 16 papers (21%), and Desharnais was third with 14. The 2012 review included more sources in its search than the 2019 review, and subjectively your author has noticed a greater use of the NASA dataset over the last five years or so.

How large are these datasets that have attracted so many research papers?

The NASA dataset contains 93 rows (that is not a typo, there is no power-of-ten missing), COCOMO 63 rows, Desharnais 81 rows, and ISBSG is licensed by the International Software Benchmarking Standards Group (academics can apply for a limited time use for research purposes, i.e., not pay the $3,000 annual subscription). The China dataset contains 499 rows, and is sometimes used (there is no mention of a supercomputer being required for this amount of data ;-).

Why are researchers involved in software effort estimation feeding tiny datasets from the 1990s into machine learning algorithms?

Grant money. Research projects are more likely to be funded if they use a trendy technique, and for the last decade machine learning has been the trendiest technique in software engineering research. What data is available to learn from? Those estimation datasets that were flogged to death in the 1990s using non-machine learning techniques, e.g., regression.

Use of machine learning also has the advantage of not needing to know anything about the details of estimating software effort. Everything can be reduced to a discussion of the machine learning algorithms, with performance judged by a chosen error metric. Nobody actually looks at the predicted estimates to discover that the models are essentially producing the same answer, e.g., one learner predicts 43 months, 2 weeks, 4 days, 6 hours, 47 minutes and 11 seconds, while a ‘better’ fitting one predicts 43 months, 2 weeks, 2 days, 6 hours, 27 minutes and 51 seconds.

How many ways are there to do machine learning on datasets containing less than 100 rows?

A paper from 2012 evaluated the possibilities using 9-learners times 10 data-prerocessing options (e.g., log transform or discretization) times 7-error estimation metrics giving 630 possible final models; they picked the top 10 performers.

This 2012 study has not stopped researchers continuing to twiddle away on the option’s nobs available to them; anything to keep the paper mills running.

To quote the authors of one review paper: “Unfortunately, we found that very few papers (including most of our own) paid any attention at all to properties of the data set.”

Agile techniques are widely used these days, and datasets from the 1990s are not applicable. What datasets do researchers use to build Agile effort estimation models?

A 2020 review of Agile development effort estimation found 73 papers. The most popular data set, containing 21 rows, was used by nine papers. Three papers used simulated data! At least some authors were going out and finding data, even if it contains fewer rows than the NASA dataset.

As researchers in business schools have shown, large datasets can be obtained from industry; ISBSG actively solicits data from industry and now has data on 9,500+ projects (as far as I can tell a small amount for each project, but that is still a lot of projects).

Are there any estimates on Github? Some Open source projects use JIRA, which includes support for making estimates. Some story point estimates can be found on Github, but the actuals are missing.

A handful of researchers have obtained and released estimation datasets containing thousands of rows, e.g., the SiP dataset contains 10,100 rows and the CESAW dataset contains over 40,000 rows. These datasets are generally ignored, perhaps because when presented with lots of real data researchers have no idea what to do with it.

Learning useful stuff from the Reliability chapter of my book

Derek Jones from The Shape of Code

What useful, practical things might professional software developers learn from my evidence-based software engineering book?

Once the book is officially released I need to have good answers to this question (saying: “Well, I decided to collect all the publicly available software engineering data and say something about it”, is not going to motivate people to read the book).

This week I checked the reliability chapter; what useful things did I learn (combined with everything I learned during all the other weeks spent working on this chapter)?

A casual reader skimming the chapter would conclude that little was known about software reliability, and they would be right (I already knew this, but I learned that we know even less than I thought was known), and many researchers continue to dig in unproductive holes.

A reader with some familiarity with reliability research would be surprised to see that some ‘major’ topics are not discussed.

The train wreck that is machine learning has been avoided (not forgetting that the data used is mostly worthless), mutation testing gets mentioned because of some interesting data (the underlying problem is that mutation testing assumes that coding mistakes are local to one line, but in practice coding mistakes often involve multiple lines), and the theory discussions don’t mention non-homogeneous Poisson process as the basis for software fault models (because this process is not capable of solving the questions asked).

What did I learn? My highlights include:

  • Anne Choa‘s work on population estimation. The takeaway from this work is that if people want to estimate the number of remaining fault experiences, based on previous experienced faults, then every occurrence (i.e., not just the first) of a fault needs to be counted,
  • Janet Dunham’s top read work on software testing,
  • the variability in the numeric percentage that people assign to probability terms (e.g., almost all, likely, unlikely) is much wider than I would have thought,
  • the impact of the distribution of input values on fault experiences may be detectable,
  • really a lowlight, but there is a lot less publicly available data than I had expected (for the other chapters there was more data than I had expected).

The last decade has seen fuzzing grow to dominate the headlines around software reliability and testing, and provide data for people who write evidence-based books. I don’t have much of a feel for how widely used it is in industry, but it is a very useful tool for reliability researchers.

Readers might have a completely different learning experience from reading the reliability chapter. What useful things did you learn from the reliability chapter?

The Algorithmic Accountability Act of 2019

Derek Jones from The Shape of Code

The Algorithmic Accountability Act of 2019 has been introduced to the US congress for consideration.

The Act applies to “person, partnership, or corporation” with “greater than $50,000,000 … annual gross receipts”, or “possesses or controls personal information on more than— 1,000,000 consumers; or 1,000,000 consumer devices;”.

What does this Act have to say?

(1) AUTOMATED DECISION SYSTEM.—The term ‘‘automated decision system’’ means a computational process, including one derived from machine learning, statistics, or other data processing or artificial intelligence techniques, that makes a decision or facilitates human decision making, that impacts consumers.

That is all encompassing.

The following is what the Act is really all about, i.e., impact assessment.

(2) AUTOMATED DECISION SYSTEM IMPACT ASSESSMENT.—The term ‘‘automated decision system impact assessment’’ means a study evaluating an automated decision system and the automated decision system’s development process, including the design and training data of the automated decision system, for impacts on accuracy, fairness, bias, discrimination, privacy, and security that includes, at a minimum—

I think there is a typo in the following: “training, data” -> “training data”

(A) a detailed description of the automated decision system, its design, its training, data, and its purpose;

How many words are there in a “detailed description of the automated decision system”, and I’m guessing the wording has to be something a consumer might be expected to understand. It would take a book to describe most systems, but I suspect that a page or two is what the Act’s proposers have in mind.

(B) an assessment of the relative benefits and costs of the automated decision system in light of its purpose, taking into account relevant factors, including—

Whose “benefits and costs”? Is the Act requiring that companies do a cost benefit analysis of their own projects? What are the benefits to the customer, compared to a company not using such a computerized approach? The main one I can think of is that the customer gets offered a service that would probably be too expensive to offer if the analysis was done manually.

The potential costs to the customer are listed next:

(i) data minimization practices;

(ii) the duration for which personal information and the results of the automated decision system are stored;

(iii) what information about the automated decision system is available to consumers;

This act seems to be more about issues around data retention, privacy, and customers having the right to find out what data companies have about them

(iv) the extent to which consumers have access to the results of the automated decision system and may correct or object to its results; and

(v) the recipients of the results of the automated decision system;

What might the results be? Yes/No, on a load/job application decision, product recommendations are a few.

Some more potential costs to the customer:

(C) an assessment of the risks posed by the automated decision system to the privacy or security of personal information of consumers and the risks that the automated decision system may result in or contribute to inaccurate, unfair, biased, or discriminatory decisions impacting consumers; and

What is an “unfair” or “biased” decision? Machine learning finds patterns in data; when is a pattern in data considered to be unfair or biased?

In the UK, the sex discrimination act has resulted in car insurance companies not being able to offer women cheaper insurance than men (because women have less costly accidents). So the application form does not contain a gender question. But the applicants first name often provides a big clue, as to their gender. So a similar Act in the UK would require that computer-based insurance quote generation systems did not make use of information on the applicant’s first name. There is other, less reliable, information that could be used to estimate gender, e.g., height, plays sport, etc.

Lots of very hard questions to be answered here.

Facebook’s Big Code Summit

Derek Jones from The Shape of Code

I was at Facebook’s first Big Code Summit on Monday and Tuesday (I say the first, because I hope there is another one next year).

The talks all involved machine learning (to be expected, given the Big Code in the event’s title). Normally I ignore papers on machine learning in software engineering, but understanding code is hard and we don’t know much about it. As I keep telling anyone who will listen, machine learning is the tool to use when you don’t know what you are doing (provided you have enough data).

People have been learning code patterns for some time now, suggesting applications in code completion in the IDE and finding suspicious API sequences (e.g., a missing call). This is one area where machine learning is a natural solution: nobody has the time to write down all the common patterns, for all the common languages, and APIs are constantly changing. It makes no sense to solve this problem manually.

So what was new and/or interesting?

We got new and very interesting in the first talk, when Eran Yahav presented his group’s work on cod2vec, the paper was interesting, but the demo had the wow factor.

I have not made up my mind about Michael Pradel‘s proposal for learning new coding rule checks. These rules are often created by people, but people with the necessary skill are thin on the ground. Machine learning requires something to learn from, how could coding rules be created this way. Michael’s group is working on a system where developers create the positive and negative cases and a machine learner figures out rules from these examples. Would the creation of these positive/negative examples prove to be just as hard as writing rules? I was not convinced that such an approach was practical, but if somebody wants to try it out, why not.

I found Xinyun Chen‘s talk interesting, but then I’ve written lots of parsers, and automatically figuring out how to parse a language from examples will always get my attention. A few people in the audience thought that a better solution was typing in a grammar and parsing the ‘usual’ way. This approach assumes a grammar exists, can be strong-armed into a form that is practical to embed in a parser (requiring somebody skilled in the necessary black arts), to produce a system that will only process complete translation units (or whatever the language calls a unit of translation).