Derek Jones from The Shape of Code
Lots of people complain about software development taking longer than estimated. Are estimates in other industries more accurate, and do they contain patterns similar to those seen in software task estimates?
Readers will probably not be surprised to learn that obtaining estimate/actual data is as hard for other industries as it is for software.
Software engineering sometimes gets compared with building construction, in the sense that building construction is perceived as being straightforward and predictable. My tiny experience with building construction is that it is not as straightforward and predictable as outsiders think, a view echoed by the few people in the building industry I have spoken to.
I have found two building datasets, the supplementary material from: Forecasting the Project Duration Average and Standard Deviation from Deterministic Schedule Information (the 101 rows also include some service projects), and Ballesteros-Pérez kindly sent me the data for Duration and Cost Variability of Construction Activities: An Empirical Study which included 746 rows of road construction estimate/actual data from an unknown source. This data is for large projects, where those involved had to bid to get the work.
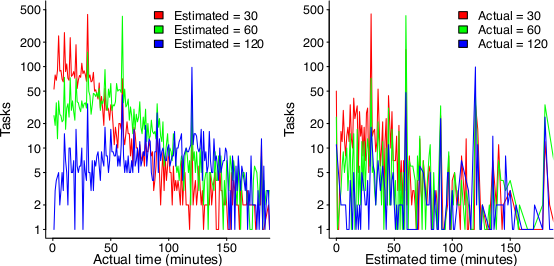
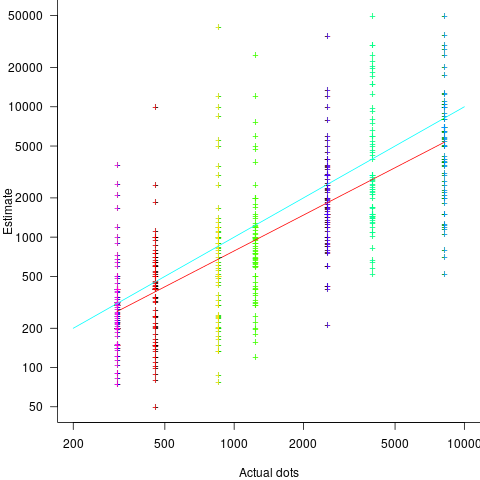
The following plot reminds us of how effort vs actual often looks like for short software tasks; it includes a fitted regression model and prediction intervals at one standard deviation (68.3%) and two standard deviations (95%); the faint grey line shows Estimate == Actual (post discussing the analysis and linking to code+data):
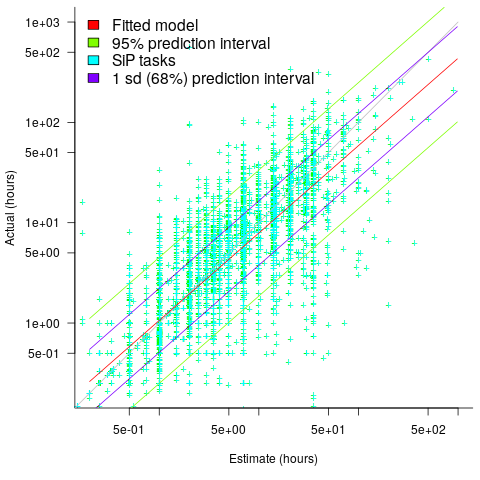
The data in the above plot is for small tasks, which did not involve bidding for the work.
The following plot shows estimated vs actual duration for 101 construction projects. The red line has the form:  , i.e., average estimate is 9% lower than actual duration (blue line shows
  ; code+data).
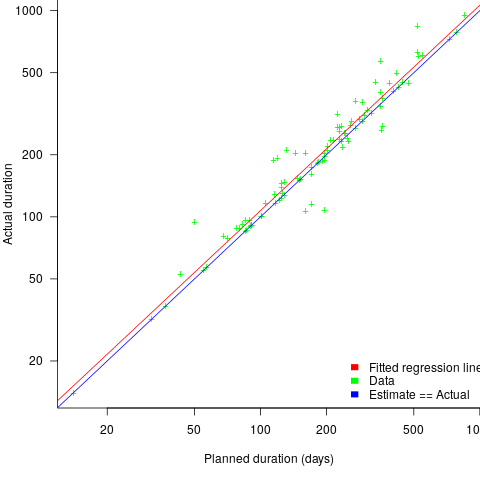
The obvious differences are that the fitted line shows consistent underestimation (hardly surprising when bidding for work; 16% of estimates are greater than the actual), that the variance of project estimate/actual about the line is much smaller for building construction, and that the red/blue lines are essentially parallel (the exponent for software tasks is consistently around 0.85, rather than 1)
The following plot shows estimated vs actual for 746 road construction projects. The red line has the form:  , i.e., average estimate is 24% lower than actual duration (blue line shows ; code+data):
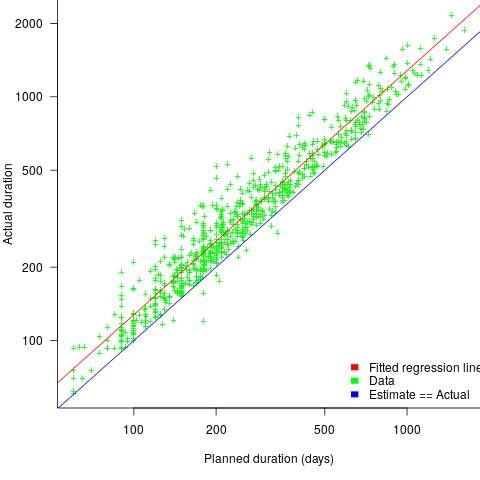
Again there is a consistent average underestimate (project bidding was via an auction process), the red/blue lines are essentially parallel, and while the estimate/actual variance is larger than for building construction only 1.5% estimates are greater than the actual.
Consistent underestimating is not surprising for external projects awarded via a bidding process.
The unpredicted differences are the much smaller estimate/actual variance (compared to software), and the fitted line running parallel to .

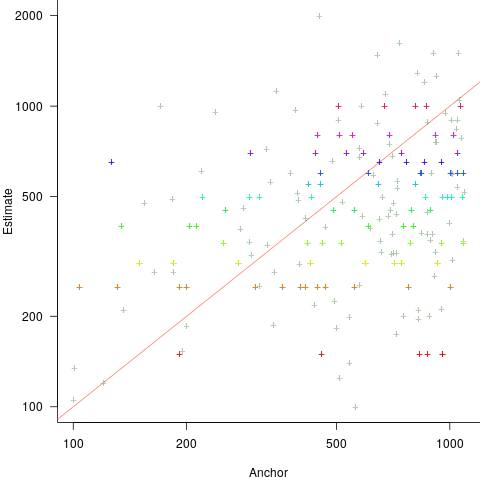
 explains 11% of the variance in the data. If the higher/lower choice is included the model, 44% of the variance is explained; higher equation is:
  and lower equation is:
  (a multiplicative model has a similar goodness of fit), i.e., the anchor has three-times the impact when it is thought to be an underestimate.
 , and red line shows the fitted regression model
  (
(
 , with the variance being similar to that found
 , and red line a fitted regression model having the form
  (which explains just over 70% of the variance;
 , with
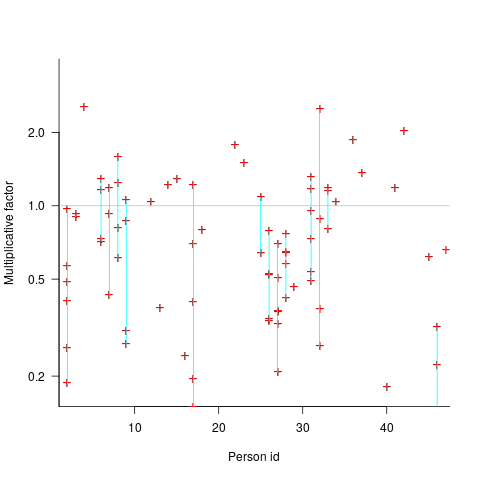
  varying between 0.65 and 1.57; more than a factor of two difference between subjects (this model explains just under 90% of the variance). This is a smaller range than the software estimation data, but with only six subjects there was less chance of a wider variation (
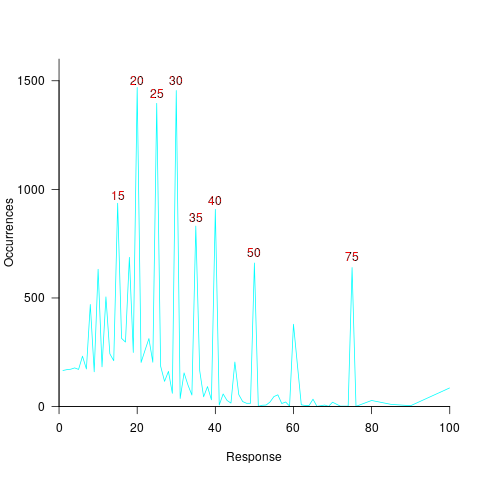
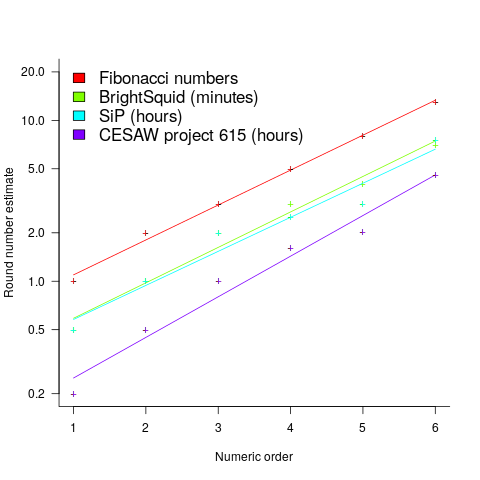
 (there is a small variation in the value of the constant; the smallest value for project 615 was probably calculated rather than being human selected).
 . I await the data needed to answer this question.
 (there is a small variation in the value of the constant; the smallest value for project 615 was probably calculated rather than being human selected).
 . I await the data needed to answer this question.
 , where
  is a constant that varies between projects, often explains around 50% of the variance present in the data. This equation shows that developers under-estimate short tasks and over-estimate long tasks. The exponent,
  , applies across most projects in the data,