Derek Jones from The Shape of Code
Round numbers are often preferred in software task estimation times, e.g., 1, 5, 7 (hours in one working day), and 14. This human preference for round numbers is not specific to software, or to estimating. Round numbers can act as goals, as clustering points, may be used more often as uncertainty increases, or be the result of satisficing, etc.
Rounding can occur in response to any question involving a numeric value, e.g., a government census or survey asking citizens about their financial situation or health. Rounding introduces error in the analysis of data. The Whipple index, described in 1919, was the first attempt to quantify the amount of error; calculated as: “per cent which the number reported as multiples of 5 forms of one-fifth of the total number between ages 23 to 62 years inclusive.” for errors of reported age. Other metrics for this error have been proposed, and packages to calculate them are available.
At some point (the evidence suggests a 1940 paper) a published paper introduced the term heaping effect. These days, heaping is more often used to name the process, compared to rounding, e.g., heaping of values; ‘heaping’ papers do use the term rounding, but I have not seen ’rounding’ papers use heaping.
The choice of rounding values depends on the unit of measurement. For instance, reported travel arrival/departure times are rounded to intervals of 5, 14, 30 and 60 minutes; based on reported/actual travel times it is possible to estimate the probability that particular rounding intervals have been used.
The Whipple index fails when all the values are large (e.g., multiple thousands), or take a small range of values (e.g., between one and twenty).
One technique for handling rounding of large values is to define roundedness in terms of the fraction of value digits that are trailing zeroes. The plot below shows the number of households having a given estimated balance on their first mortgage in the 2013 Survey of Consumer Finances (in red), and the distribution of actual balances reported by the New York Federal Reserve (in blue/green; data extracted from plot in a paper and scaled to equalize total mortgage values; code+data):
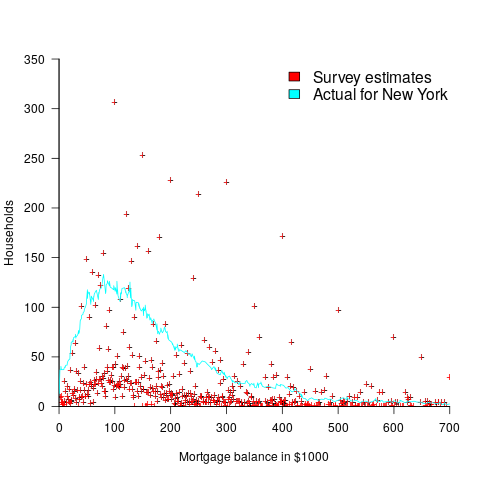
The relatively high number of distinct round numbers swamps any underlying distribution of actual values. While some values having some degree of roundness occur more often than non-round values, they still appear less often than expected by the known distribution. It is possible that homeowners have mortgages at round values because they of banking limits, or reasons other than rounding when answering the survey.
The plot below shows the number of people reporting having a given number of friends, plus number of cigarettes smoked per day, from the 2015 survey of Objective and Subjective Quality of Life in Poland (code+data):
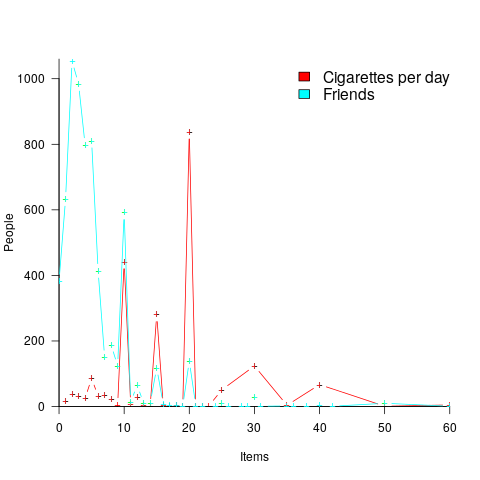
The narrow range of a person’s number of friends prevents the Whipple index from effectively detecting rounding/heaping.
The dominance of round numbers in the cigarettes smoked per day may be caused by the number of cigarettes contained in a packet, i.e., people may be accurately reporting that they smoke the contents of a packet, rather than estimating a rounded number.
Simple techniques are available for correcting the mean/variance when values are always rounded to specified boundaries. When the probability of rounding is not 100%, the calculation is more complicated.
Rounded/Heaped data contains multiple distributions, i.e., the non-rounded values and the rounded values; various mixture models have been proposed to fit such data. Alternatively, the data can be ‘deheaped’, and various deheaping techniques have been proposed.
Given the prevalence of significant amounts of rounding/heaping, it’s surprising how few people know about it.