Derek Jones from The Shape of Code
The process used to generate the pdf of my evidence-based software engineering book has been on my list of things to blog about, for ever. An email arrived this afternoon, asking how I produced various effects using Asciidoc; this post probably contains rather more than N. Psaris wanted to know.
It’s very easy to get sucked into fiddling around with page layout and different effects. So, unless I am about to make a release of a draft, I only generate a pdf once, at the end of each month.
At the end of the month the text is spell checked using aspell, and then grammar checked using Language tool. I have an awk script that checks the text for mistakes I have made in the past; this rarely matches, i.e., I seem to be forever making different mistakes.
The sequencing of tools is: R (Sweave) -> Asciidoc -> docbook -> LaTeX -> pdf; assorted scripts fiddle with the text between outputs and inputs. The scripts and files mention below are available for download.
R generates pdf files (via calls to the Sweave function, I have never gotten around to investigating Knitr; the pdfs are cropped using scripts/pdfcrop.sh) and the ascii package is used to produce a few tables with Asciidoc markup.
Asciidoc is the markup language used for writing the text. A few years after I started writing the book, Stuart Rackham, the creator of Asciidoc, decided to move on from working and supporting it. Unfortunately nobody stepped forward to take over the project; not a problem, Asciidoc just works (somebody did step forward to reimplement the functionality in Ruby; Asciidoctor has an active community, but there is no incentive for me to change). In my case, the output from Asciidoc is xml (it supports a variety of formats).
Docbook appears in the sequence because Asciidoc uses it to produce LaTeX. Docbook takes xml as input, and generates LaTeX as output. Back in the day, Docbook was hailed as the solution to all our publishing needs, and wonderful tools were going to be created to enable people to produce great looking documents.
LaTeX is the obvious tool for anybody wanting to produce lovely looking books and articles; tex/ESEUR.tex is the top-level LaTeX, which includes the generated text. Yes, LaTeX is a markup language, and I could have written the text using it. As a language I find LaTeX too low level. My requirements are not complicated, and I find it easier to write using a markup language like Asciidoc.
The input to Asciidoc and LuaTeX (used to generate pdf from LaTeX) is preprocessed by scripts (written using sed and awk; see scripts/mkpdf). These scripts implement functionality that Asciidoc does not support (or at least I could see how to do it without modifying the Python source). Scripts are a simple way of providing the extra functionality, that does not require me to remember details about the internals of Asciidoc. If Asciidoc was being actively maintained, I would probably have worked to get some of the functionality integrated into a future release.
There are a few techniques for keeping text processing scripts simple. For instance, the cost of a pass over text is tiny, there is little to be gained by trying to do everything in one pass; handling the possibility that markup spans multiple lines can be complicated, a simple solution is to join consecutive lines together if there is a possibility that markup spans these lines (i.e., the actual matching and conversion no longer has to worry about line breaks).
Many simple features are implemented by a script modifying Asciidoc text to include some ‘magic’ sequence of characters, which is subsequently matched and converted in the generated LaTeX, e.g., special characters, and hyperlinks in the pdf.
A more complicated example handles my desire to specify that a figure appear in the margin; the LaTeX sidenotes package supports figures in margins, but Asciidoc has no way of specifying this behavior. The solution was to add the word “Margin”, to the appropriate figure caption option (in the original Asciidoc text, e.g., [caption="Margin ", label=CSD-95-887]), and have a script modify the LaTeX generated by docbook so that figures containing “Margin” in the caption invoked the appropriate macro from the sidenotes package.
There are still formatting issues waiting to be solved. For instance, some tables are narrow enough to fit in the margin, but I have not found a way of embedding this information in the table information that survives through to the generated LaTeX.
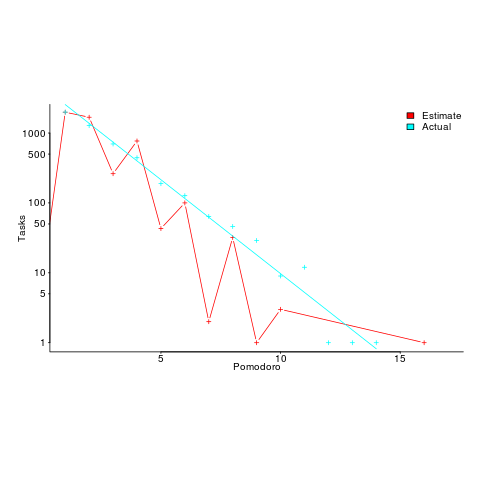
My long time pet hate is the formatting used by R’s plot function for exponentiated values as axis labels. My target audience are likely to be casual users of R, so I am sticking with basic plotting (i.e., no calls to ggplot). I do wish the core R team would integrate the code from the magicaxis package, to bring the printing of axis values into the era of laser printers and bit-mapped displays.
Ideas and suggestions welcome.
 , where:
  is a constant and
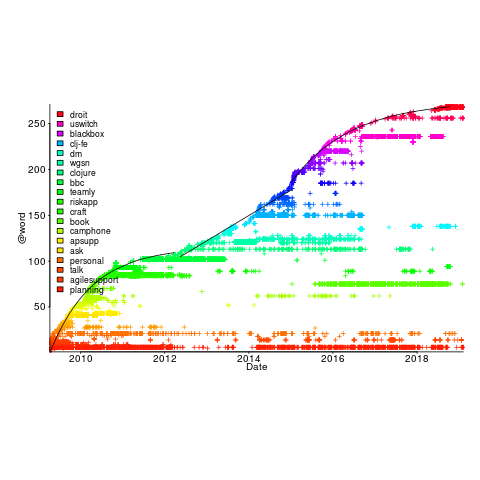
  is the number of days since the start of the interval fitted. The second (middle) black line is a fitted straight line.