Join us for the process sessions at nor(DEV):con 2019: #Evolution from #NoProjects to Continuous Digital!

Paul Grenyer from Paul Grenyer


Join us for the process sessions at nor(DEV):con 2019 on Friday 22nd and Saturday 23rd of February in Norwich!

Get your Early Bird tickets here before they finish on Friday!


# Evolution from #NoProjects to Continuous Digital

Allan Kelley

Once upon a time there was IT, and IT departments had projects. Projects were always a bad fit for software development but somehow we made them work. As IT became Agile the damage caused by the project model became obvious and #NoProjects emerged to help teams go beyond projects.

Today growth businesses are digital. Technology is the business and the business is technology. Projects end but do you want your business to end? Or do you want it to grow? Growing a digital business means growing software technology.

In this presentation Allan Kelly will look at how #NoProjects came about, how it evolved into Continuous Digital and why it is the future of management.


Miscellaneous Process Tips
Jon Jagger

This session will explore three important process laws.

1. The New Law.
Why does nothing new ever work?

2. The Chatelier’s Principle.
How do systems change? How do they stay the same?

3. The Composition Fallacy.
No difference plus no difference equals no difference is a fallacy. Why?


Jugaad: Bringing Troubled Projects Back On Track
Giovanni Asproni

What do you do when a project is not going well—e.g., the client is upset, the team demoralized, the quality of the product is low, the project is late—to bring it back under control and make the client and the team happy again?

How do you that in highly politically charged environments?

In this talk I’ll answers the questions above and more, by sharing my experience in doing that in several projects of various sizes (from small to quite big) using some jugaad—a Hindi word, which, roughly, means thinking in a frugal way and being flexible, which, in turn, requires the ability to adapt quickly to often unforeseen situations and uncertain circumstances in an intelligent way.

I’ll describe, among other things, how to:

  • Work in highly politically charged environments
  • Deal with difficult (and powerful) people and speak truth to them
  • Help the teams to improve their morale and motivation
  • Make progress with limited resources
  • Use different leadership stiles (including command and control)
  • Make your client happier
  • Deal with serious mistakes


Bug-First Development – Agile Software Development For User Story Prospecting
Adrian Pickering

The idea behind bug-first or bug-driven development is devilishly simply: Everything is a bug until it isn’t.

As far as a user is concerned, there is essentially no difference between a bug, a feature that hasn’t been delivered and one that is otherwise unusable, say through substandard user interface or user experience. Bug-driven development essentially asks the user what operation they want to do next that they currently can’t undertake. The benefit this brings is laser-focused story discovery and prioritisation.


Working remote vs Working colocated
Paul Boocock

We often talk about waterfall, scrum, agile and many other processes but these are often considered from a colocated perspective.

As demand for remote working continues to increase, we will discuss if our usual processes work in a remote environment and what changes or considerations do we need to make to support remote workers?


One Team, Two Teams, Many Teams: Scaling Up Done Right (90 or 45 minutes, 90 preferred)
Giovanni Asproni

Scaling up software projects is one of the trends of the moment—many companies, big and small, try to do that  to increase the speed of delivery of their projects.

However, scaling up can be quite difficult (even going only from one to two teams),  especially if it is done focusing on the wrong aspects – most companies give too much weight to formal structures and processes (e.g., mandating the use of SAFe, LESS or other frameworks), and not enough weight to other aspects that would give a bigger bang for the buck: eg removing friction, improving communication channels, setting clear goals, delegating responsibility and accountability, etc.

In this session I’ll share my experience in successfully helping companies to do the right thing in projects ranging from two to about eighty teams, and I’ll offer some tools that you will be able to use right away in your projects.

The session, among other things, includes:

  • A description of what needs to be done right before scaling up
  • Strategies on how to decide when to add new people to a team and new teams to a project
  • Things to consider when deciding the structure of the teams (eg feature vs component teams), and its relationship with the shape of the system
  • How to use simple rules to allow teams to collaborate productively
  • An explanation on why each project has a upper bound in its ability to scale, and what to do about it


Reengineering a Library
Burkhard Kloss

Session abstract: Over the last few years, I’ve been consulting on reengineering a quant library. As is wont, the library had originally accreted, rather than been designed; eventually, it had turned into a ball of mud, and maintenance was becoming increasingly problematic. We decided to rewrite the library from scratch, using best practices as we understood them, and eventually turned it into a piece of code we can be proud of – and maintain and extend without too much pain.

This talk is a personal retrospective on techniques and processed we applied; what worked, what did not, and why.


Get your tickets now: http://nordevcon-2019.eventbrite.com

Performance of Java 2D drawing operations

Andy Balaam from Andy Balaam's Blog

I want to remodel the desktop UI of my game Rabbit Escape to be more
convenient and nicer looking, so I took a new look at game-loop-style graphics rendering onto a canvas in a Java 2D (Swing) UI.

Specifically, how fast can it be, and what pitfalls should I avoid when I’m doing it?

Results

  • Larger windows are (much) slower
  • Resizing images on-the-fly is very slow, even if they are the same size every time
  • Drawing small images is fast, but drawing large images is slow
  • Drawing rectangles is fast
  • Drawing text is fast
  • Drawing Swing widgets in front of a canvas is fast
  • Creating fonts on-the-fly is a tiny bit slow

Code

You can find the full code (written in Kotlin) at gitlab.com/andybalaam/java-2d-performance.

Basically, we make a JFrame and a Canvas and tell them not to listen to repaints (i.e. we control their drawing).

val app = JFrame()
app.ignoreRepaint = true
val canvas = Canvas()
canvas.ignoreRepaint = true

Then we add any buttons to the JFrame, and the canvas last (so it displays behind):

app.add(button)
app.add(canvas)

Now we make the canvas double-buffered and get hold of a buffer image for it:

app.isVisible = true
canvas.createBufferStrategy(2)
val bufferStrategy = canvas.bufferStrategy
val bufferedImage = GraphicsEnvironment
    .getLocalGraphicsEnvironment()
    .defaultScreenDevice
    .defaultConfiguration
    .createCompatibleImage(config.width, config.height)

Then inside a tight loop we draw onto the buffer image:

val g2d = bufferedImage.createGraphics()
try
{
    g2d.color = backgroundColor
    g2d.fillRect(0, 0, config.width, config.height)

    ... the different drawing operations go here ...

and then swap the buffers:

    val graphics = bufferStrategy.drawGraphics
    try {
        graphics.drawImage(bufferedImage, 0, 0, null)
        if (!bufferStrategy.contentsLost()) {
            bufferStrategy.show()
        }
    } finally {
        graphics.dispose()
    }
} finally {
    g2d.dispose()
}

Results

Baseline: some rectangles

I decided to compare everything against drawing 20 rectangles at random points on the screen, since that seems like a minimal requirement for a game.

My test machine is an Intel Core 2 Duo E6550 2.33GHz with 6GB RAM and a GeForce GT 740 graphics card (I have no idea whether it is being used here – I assume not). I am running Ubuntu 18.04.1 Linux, OpenJDK Java 1.8.0_191, and Kotlin 1.3.20-release-116. (I expect the results would be identical if I were using Java rather than Kotlin.)

I ran all the tests in two window sizes: 1600×900 and 640×480. 640.×480 was embarrassingly fast for all tests, but 1600×900 struggled with some of the tasks.

Drawing rectangles looks like this:

g2d.color = Color(
    rand.nextInt(256),
    rand.nextInt(256),
    rand.nextInt(256)
)
g2d.fillRect(
    rand.nextInt(config.width / 2),
    rand.nextInt(config.height / 2),
    rand.nextInt(config.width / 2),
    rand.nextInt(config.height / 2)
)

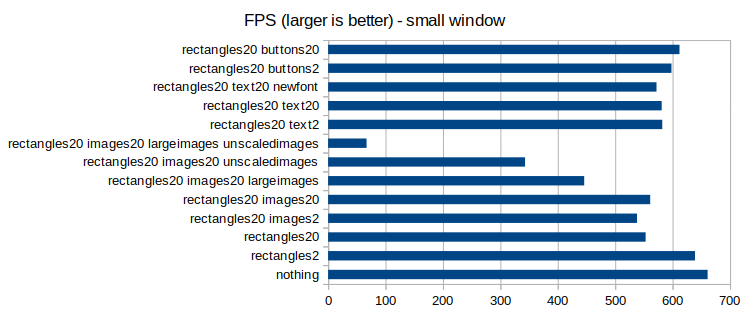
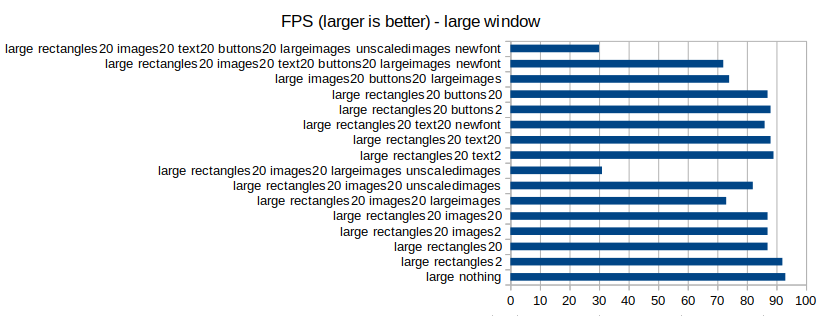
In the small window, the baseline (20 rectangles) ran at 553 FPS. In the large window it ran at 87 FPS.

I didn’t do any statistics on these numbers because I am too lazy. Feel free to do it properly and let me know the results – I will happily update the article.

Fewer rectangles

When I reduced the number of rectangles to do less drawing work, I saw small improvements in performance. In the small window, drawing 2 rectangles instead of 20 increased the frame rate from 553 to 639, but there is a lot of noise in those results, and other runs were much closer. In the large window, the same reduction improved the frame rate from 87 to 92. This is not a huge speed-up, showing that drawing rectangles is pretty fast.

Adding fixed-size images

Drawing pre-scaled images looks like this:

g2d.drawImage(
    image,
    rand.nextInt(config.width),
    rand.nextInt(config.height),
    null
)

When I added 20 small images (40×40 pixels) to be drawn in each frame, the performance was almost unchanged. In the small window, the run showing 20 images per frame (as well as rectangle) actually ran faster than the one without (561 FPS versus 553), suggesting the difference is negligible and I should do some statistics. In the large window, the 20 images version ran at exactly the same speed (87 FPS).

So, it looks like drawing small images costs almost nothing.

When I moved to large images (400×400 pixels), the small window slowed down from 553 to 446 FPS, and the large window slowed from 87 to 73 FPS, so larger images clearly have an impact, and we will need to limit the number and size of images to keep the frame rate acceptable.

Scaling images on the fly

You can scale an image on the fly as you draw onto a Canvas. (Spoiler: don’t do this!)

My code looks like:

val s = config.imageSize
val x1 = rand.nextInt(config.width)
val y1 = rand.nextInt(config.height)
val x2 = x1 + s
val y2 = y1 + s
g2d.drawImage(
    unscaledImage,
    x1, y1, x2, y2,
    0, 0, unscaledImageWidth, unscaledImageHeight,
    null
)

Note the 10-argument form of drawImage is being used. You can be sure you have avoided this situation if you use the 4-argument form from the previous section.

Note: the resulting image is the same size every time, and the Java documentation implies that scaled images may be cached by the system, but I saw a huge slow-down when using the 10-argument form of drawImage above.

On-the-fly scaled images slowed the small window from 446 to 67 FPS(!), and the large window from 73 to 31 FPS, meaning the exact same rendering took over twice as long.

Advice: check you are not using one of the drawImage overloads that scales images! Pre-scale them yourself (e.g. with getScaledInstance as I did here).

Displaying text

Drawing text on the canvas like this:

g2d.font = Font("Courier New", Font.PLAIN, 12)
g2d.color = Color.GREEN
g2d.drawString("FPS: $fpsLastSecond", 20, 20 + i * 14)

had a similar impact to drawing small images – i.e. it only affected the performance very slightly and is generally quite fast. The small window slowed from 553 to 581 FPS, and the large window from 87 to 88.

Creating the font every time (as shown above) slowed the process a little more, so it is worth moving the font creating out of the game loop and only doing it once. The slowdown just for creating the font was 581 to 572 FPS in the small window, and 88 to 86 FPS in the large.

Swing widgets

By adding Button widgets to the JFrame before the Canvas, I was able to display them in front. Their rendering and focus worked as expected, and they had no impact at all on performance.

The same was true when I tried adding these widgets in front of images rendered on the canvas (instead of rectangles).

Turning everything up to 11

When I added everything I had tested all at the same time: rectangles, text with a new font every time, large unscaled images, and large window, the frame rate reduced to 30 FPS. This is a little slow for a game already, and if we had more images to draw it could get even worse. However, when I pre-scaled the images the frame rate went up to 72 FPS, showing that Java is capable of running a game at an acceptable frame rate on my machine, so long as we are careful how we use it.

Numbers

Small window (640×480)

Test FPS
nothing 661
rectangles2 639
rectangles20 553
rectangles20 images2 538
rectangles20 images20 561
rectangles20 images20 largeimages 446
rectangles20 images20 unscaledimages 343
rectangles20 images20 largeimages unscaledimages 67
rectangles20 text2 582
rectangles20 text20 581
rectangles20 text20 newfont 572
rectangles20 buttons2 598
rectangles20 buttons20 612

Large window (1200×900)

Test FPS
large nothing 93
large rectangles2 92
large rectangles20 87
large rectangles20 images2 87
large rectangles20 images20 87
large rectangles20 images20 largeimages 73
large rectangles20 images20 unscaledimages 82
large rectangles20 images20 largeimages unscaledimages 31
large rectangles20 text2 89
large rectangles20 text20 88
large rectangles20 text20 newfont 86
large rectangles20 buttons2 88
large rectangles20 buttons20 87
large images20 buttons20 largeimages 74
large rectangles20 images20 text20 buttons20 largeimages newfont 72
large rectangles20 images20 text20 buttons20 largeimages unscaledimages newfont 30

Feedback please

Please do get back to me with tips about how to improve the performance of my experimental code.

Feel free to log issues, make merge requests or add comments to the blog post.

Join us for the nor(DEV):con 2019 Business Sessions: Running a business is hard!

Paul Grenyer from Paul Grenyer


Join us for the nor(DEV):con 2019 Business Sessions on Friday 22nd February!

Get your Early Bird tickets here before the price goes up after Friday!

Running a business is hard

John Gostling

Running a business is hard….harder when you don’t have much experience of running a business! 6 years ago I joined Breakwater IT as a Systems Engineer, I quickly realised there was so much potential that had yet to be tapped into, and every day since then my focus has been on releasing this, creating a better company to work with, and to work for. It’s been a constantly evolving journey, 2 steps forward, one step back (sometimes two!), but things are finally starting to fall into place.

This is a very open self-appraisal of the how we have transformed a loss making company into one that turns a profit and is currently growing at 20% year on year.


Crack the motivation code!

Cassandra Andrews

Imagine if you knew precisely what motivated each member of your team, how motivated they were and what you could do to improve their motivation! 

Cassandra Andrews interactive workshop focuses on motivation in the workplace and introduces ‘motivational maps’, an incredibly accurate and user-friendly tool which enables us to unlock and measure employee motivation.

Understanding exactly what motivates individuals in an organisation can be used with significant impact to support business growth and profitability by maximising employee and team motivation, retain employees and recruit the right people to complement existing teams.

At the workshop you will discover how to create high performing teams by learning:

What motivation is, how it can be measured and how it impacts the workforce.
About the nine motivators identified in motivational maps.
How to increase team performance by identifying conflicts in motivation.

To enable all delegates to get their own ‘wow’ moment from the workshop, there will be an opportunity for four attendees to win a complimentary individual motivational map with feedback/insight session and discounted motivational maps available for other attendees.


Developing an app to promote emotional resilience

UEA

Since summer 2017, Dr Laura Biggart and Dr Kamena Henshaw, from the School of Psychology, have been working with UEA computer science students and Steve Jones and Adam Ziolkowski from JoziTech to develop a student support app. Currently the app is focused on supporting students’ transition into Higher Education. In this session we will talk about the development of the app, the research background to the features, and the feedback since our launch in September 2018. We will conclude with a discussion of our future plans, including evaluation of the app and our plans to work with other organisations to develop bespoke OpenUp apps


Don’t fall over like Elon Musk did – How to stay energised and disrupt an industry

Ian Hacon

Elon Musk is one of the most famous workaholic cases in recent years. So much so, many others quoted him as a badge of honour when they too worked too hard. In 2018, his wheel fell off, forced to take a total break due to exhaustion. This session will help you understand how looking after your own energy is good for business and you will leave with some easily implementable steps to do so.


Orchestrated Mobility – Changing The Way We Move

John Fagan

By late 2030, its predicted that 95% U.S. passenger miles travelled will be served by on-demand vehicles owned by fleets, not individuals, in a new business model Transport-as-a-Service (TaaS).

Citizens will pay a monthly fee to go anywhere they wish, much like we do today using on demand services for music and video, like Spotify and Netflix.

TaaS will unify public, private & autonomous transportation into an efficient service and is predicted to deliver a largely carbon-free road transportation system.

In this talk i will…

Vision of Transport as a Service

Key Drivers (Technologies, Autonomous electric vehicles, ride sharing, costs and barriers)
Impacts on society, economics and the environment
Who should be the Netflix for Transport?
Examples of use cases and disruption happening today


Harnessing the power of subscription technology

Juliana Meyer

Thousands of professionals are discovering ways to transform the way they work and the way they earn a living. Leveraging the skills we each have, the talk uncovers how anyone can can build their own subscription business using the knowledge and talents they already have.

I’ll go deep into the steps needed, opportunities available, the how and why, and what has worked and not worked for others. This has already been a game changer for others who learnt this from my previous talks which then transformed their lives, their living, and their opportunities.

Given the key trends of subscription, technology and self-education, I’ll explore and explain how anyone can successfully launch their own apps from home to generate a passive income and lift the lid on exchanging time for money.


Get your tickets here: http://nordevcon-2019.eventbrite.com

Archimedean Crew – a.k.

a.k. from thus spake a.k.

We have recently seen how we can define dependencies between random variables with Archimedean copulas which calculate the probability that they each fall below given values by applying a generator function φ to the results of their cumulative distribution functions, or CDFs, for those values, and applying its inverse to their sum.
Like all copulas they are effectively the CDFs of vector valued random variables whose elements are uniformly distributed when considered independently. Whilst those Archimedean CDFs were relatively trivial to implement, we found that their probability density functions, or PDFs, were somewhat more difficult and that the random variables themselves required some not at all obvious mathematical manipulation to get right.
Having done all the hard work implementing the ak.archimedeanCopula, ak.archimedeanCopulaDensity and ak.archimedeanCopulaRnd functions we shall now use them to implement some specific families of Archimedean copulas.

Modeling visual studio C++ compile times

Derek Jones from The Shape of Code

Last week I spotted an interesting article on the compile-time performance of C++ compilers running under Microsoft Windows. The author had obviously put a lot of work into gathering the data, and had taken care to have multiple runs to reduce the impact of random effects (128 runs to be exact); but, as if often the case, the analysis of the data was lackluster. I posted a comment asking for the data, and a link was posted the next day :-)

The compilers benchmarked were: Visual Studio 2015, Visual Studio 2017 and clang 7.0.1; the compilers were configured to target: C++20, C++17, C++14, C++11, C++03, or C++98. The source code used was 100 system headers.

If we are interested in understanding the contribution of each component to overall compile-time, the obvious fist regression model to build is:

compile_time = header_x+compiler_y+language_z

where: header_x are the different headers, compiler_y the different compilers and language_z the different target languages. There might be some interaction between variables, so something more complicated was tried first; the final fitted model was (code+data):

compile_time = k+header_x+compiler_y+language_z+compiler_y*language_z

where k is a constant (the Intercept in R’s summary output). The following is a list of normalised numbers to plug into the equation (clang is the default compiler and C++03 the default language, and so do not appear in the list, the : symbol represents the multiplication; only a few of the 100 headers are listed, details are available):

                             Estimate Std. Error  t value Pr(>|t|)    
               (Intercept)                  headerany 
               1.000000000                0.051100398 
               headerarray             headerassert.h 
               0.522336397               -0.654056185 
...
            headerwctype.h            headerwindows.h 
              -0.648095154                1.304270250 
              compilerVS15               compilerVS17 
              -0.185795534               -0.114590143 
             languagec++11              languagec++14 
               0.032930014                0.156363433 
             languagec++17              languagec++20 
               0.192301727                0.184274629 
             languagec++98 compilerVS15:languagec++11 
               0.001149643               -0.058735591 
compilerVS17:languagec++11 compilerVS15:languagec++14 
              -0.038582437               -0.183708714 
compilerVS17:languagec++14 compilerVS15:languagec++17 
              -0.164031495                         NA 
compilerVS17:languagec++17 compilerVS15:languagec++20 
              -0.181591418                         NA 
compilerVS17:languagec++20 compilerVS15:languagec++98 
              -0.193587045                0.062414667 
compilerVS17:languagec++98 
               0.014558295 

As an example, the (normalised) time to compile wchar.h using VS15 with languagec++11 is:
1-0.514807638-0.183862162+0.033951731-0.059720131

Each component adds/substracts to/from the normalised mean.

Building this model didn’t take long. While waiting for the kettle to boil, I suddenly realised that an additive model was probably inappropriate for this problem; oops. Surely the contribution of each component was multiplicative, i.e., components have a percentage impact to performance.

A quick change to the form of the fitted model:

log(compile_time) = k+header_x+compiler_y+language_z+compiler_y*language_z

Taking the exponential of both side, the fitted equation becomes:

compile_time = e^{k}e^{header_x}e^{compiler_y}e^{language_z}e^{compiler_y*language_z}

The numbers, after taking the exponent, are:

               (Intercept)                  headerany 
              9.724619e+08               1.051756e+00 
...
            headerwctype.h            headerwindows.h 
              3.138361e-01               2.288970e+00 
              compilerVS15               compilerVS17 
              7.286951e-01               7.772886e-01 
             languagec++11              languagec++14 
              1.011743e+00               1.049049e+00 
             languagec++17              languagec++20 
              1.067557e+00               1.056677e+00 
             languagec++98 compilerVS15:languagec++11 
              1.003249e+00               9.735327e-01 
compilerVS17:languagec++11 compilerVS15:languagec++14 
              9.880285e-01               9.351416e-01 
compilerVS17:languagec++14 compilerVS15:languagec++17 
              9.501834e-01                         NA 
compilerVS17:languagec++17 compilerVS15:languagec++20 
              9.480678e-01                         NA 
compilerVS17:languagec++20 compilerVS15:languagec++98 
              9.402461e-01               1.058305e+00 
compilerVS17:languagec++98 
              1.001267e+00 

Taking the same example as above: wchar.h using VS15 with c++11. The compile-time (in cpu clock cycles) is:
9.724619e+08*3.138361e-01*7.286951e-01*1.011743e+00*9.735327e-01

Now each component causes a percentage change in the (mean) base value.

Both of these model explain over 90% of the variance in the data, but this is hardly surprising given they include so much detail.

In reality compile-time is driven by some combination of additive and multiplicative factors. Building a combined additive and multiplicative model is going to be like wrestling an octopus, and is left as an exercise for the reader :-)

Given a choice between these two models, I think the multiplicative model is probably closest to reality.

xkcd-style plots in MatPlotLib

Frances Buontempo from BuontempoConsulting

Most programmers I know are familiar with xkcd, the webcomic of romance, sarcasm, math, and language. In order to create diagrams for my machine learning book, I wanted a way to create something I could have fun with.

I discovered that Python's MatPlotLib library has an xkcd style, which you simply wrap round a plot. This allowed me to piece together what I needed using line segments, shapes, and labels.

Given a function, f, which draws what you need on some axes ax, use the style like this, and you're done:

with plt.xkcd():
    fig = plt.figure()
    ax = fig.add_subplot(1,1,1)
    f(ax)

    plt.show()

For example to explain what happens when you fire cannons at different angles:


I gave a talk at Skillsmatter, called "Visualisation FTW", which was recorded, so you can watch it if you want. I also wrote this up for ACCU's CVu magazine. The ACCU runs an annual best article survey, and I was runner up, which was a pleasant surprise. You need to be a member to view the article, but it covers the same ground as the short talk at Skillsmatter.

Buy a copy of my book, or go play with xkcd style pictures. Have fun; I did.


London Python Meetup January 2019 – Async Python and GeoPandas

Andy Balaam from Andy Balaam's Blog

It was a pleasure to go to the London Python Meetup organised by @python_london. There were plenty of friendly people and interesting conversations.

I gave a talk “Making 100 million requests with Python aiohttp” (slides) explaining the basics of writing async code in Python 3 and how I used that to make a very large number of HTTP requests.

Andy giving the presentation

(Photo by CB Bailey.)

Hopefully it was helpful – there were several good questions, so I am optimistic that people were engaged with it.

After that, there was an excellent talk by Gareth Lloyd called “GeoPandas, the geospatial extension for Pandas” in which he explained how to use the very well-developed geo-spatial data tools available in the Python ecosphere to transform, combine, plot and analyse data which includes location information. I was really impressed with how easy the libraries looked to use, and also with the cool Jupyter notebook Gareth used to explain the ideas using live demos.

London Python Meetups seem like a cool place to meet Pythonistas of all levels of experience in a nice, low-pressure environment!

Meetup link: aiohttp / GeoPandas

Visual Lint 7.0.5.314 has been released

Products, the Universe and Everything from Products, the Universe and Everything

This is a recommended maintenance update for Visual Lint 7.0. The following changes are included:

  • If an output report folder is specified on the command line and its path is relative, VisualLintConsole now resolves it before starting analysis. This ensures that the path referenced in any status/progress messages is is unambiguous.

  • Fixed a bug in VisualLintConsole in the copying of Javascript baggage files to the (optional) output report folder.

  • Fixed a minor display bug in the VisualLintGui "Projects" Display.