Visual Lint 7.0.3.311 has been released

Products, the Universe and Everything from Products, the Universe and Everything

This is a recommended maintenance update for Visual Lint 7.0. The following changes are included:

  • Fixed a bug in the Visual Studio 2017/2019 installation process which can cause an invalid filename to be specified for VSIX logfiles written to the %TEMP% folder.
  • The timestamps of any property (.props, .targets or .vsprops) files referenced by a Visual Studio project are now taken into account when determining whether a new PC-lint/PC-lint Plus indirect (.lnt) file needs to be written.
  • Added a breadcrumb bar to HTML solution, project and file reports to make navigating to the report for the parent entity (e.g. from file to project) easier.
  • Fixed a bug which could cause an invalid -setenv() directive to be generated on the PC-lint Plus analysis command line if a platform name referenced in a project contained one or more spaces.
  • Replaced the "invalid key entered" balloon tip in the Registration Key Dialog with an inline text field.
  • Added a missing help topic.

Download Visual Lint 7.0.3.311

Plotting artifacts when the axis involves lines of code

Derek Jones from The Shape of Code

While reading a report from the very late Rome period, the plot below caught my attention (the regression line was not in the original plot). The points follow a general trend, suggesting that when implementing a module, lines of code written per man-hour increases as the size of the module increases (in LOC). There are explanations for such behavior: perhaps module implementation time is mostly think-time that is independent of LOC, or perhaps larger modules contain more lines that can be quickly implemented (code+data).

Then I realised that the pattern of points was generated by a mathematical artifact. Can you spot the artifact?

Module size against LOC-per-hour.

The x-axis shows LOC, and the y-axis shows LOC/man-hour. Just plotting LOC against LOC would produce a row of points along a straight line, and if we treat dividing by man-hours as roughly equivalent to dividing by a random number (which might have some correlation with LOC), the result is points scattered around a line going up to the right.

If LOC-per-hour were constant, the points would form a horizontal line across the plot.

In the below left plot, from a different report (whose axis are function-points, and function-points implemented per month), the author has fitted a line, and it is close to horizontal (suggesting that the mean FP-per-month is constant).

FP against FP-per-month.

In fact the points are essentially random, and the line is a terrible fit (just how terrible is shown by switching the axis and refitting the line, above right; the refitted line should be vertical, but is horizontal. There is no connection between FP and FP-per-month, which is a good thing because the creators of function-points intended this to be true).

What process might generate this random scattering, rather than the trend seen in the first plot? If the implementation time was proportional to both the number of FP and some uniform random component, then the FP/time ratio would have the pattern seen.

The plots below show module size (in LOC) against man-hour (left) and FP against months (right):

Module size against man-hours, and FP against months.

The module-LOC points are all over the place, while the FP points look as-if they are roughly consistent. Perhaps the module-LOC measurements came from a wide variety of sources, and we should not expect a visually pleasant trend.

Plotting LOC against LOC appears in other guises. Perhaps the most common being plotting fault-density against LOC; fault-density is generally calculated as faults/LOC.

Of course the artifacts also occur when plotting other kinds of measurements. Lines of code happens to be a commonly plotted quantity (at least in software engineering).

Further Still On An Ethereal Orrery – student

student from thus spake a.k.

Recently, my fellow students and I constructed a mathematical orrery which modelled the motion of heavenly bodies employing Sir N-----'s laws of gravitation and motion, rather than clockwork, as its engine. Those laws state that bodies are attracted toward each other with a force proportional to the product of their masses divided by the square of the distance between them, that a body will remain at rest or in constant motion unless a force acts upon it, that if a force acts upon it then it will be accelerated in the direction of that force at a rate proportional to its strength divided by its mass and that, if so, it will reciprocate with an opposing force of equal strength.
Its operation was most satisfactory, which set us to wondering whether we might use its engine to investigate the motions of entirely hypothetical arrangements of heavenly bodies and I should now like to report upon our progress in doing so.

nor(DEV):biz Big Dinner with Roarr! Dinosaur Adventure

Paul Grenyer from Paul Grenyer


What: nor(DEV):biz Big Dinner with Roarr! Dinosaur Adventure

When: 7th October, 2019

Where: Norwich City Football Club

How much: £40.99

Book: https://nordevbiz-oct-2019.eventbrite.co.uk

Join the best Norfolk and Norwich tech companies for dinner, while enjoying good food and great company.

Roarr! Dinosaur Adventure

A desire to innovate, with continual reinvestment creating bigger and bolder attractions – this is what our guest speakers have in mammoth (or should I say dinosaur!) proportions.

Owners of award-winning, Roarr! Dinosaur Adventure in Lenwade, Martin and Adam Goymour will be sharing their aspirations to develop this thriving business both in Norfolk and further afield. Not ones to rest on their laurels, they’ve already rebranded and invested millions so they can appeal to a broader market.

In 2018, they won the Best Large Visitor Attraction award in the Norfolk and Suffolk Tourism Awards. With more projects ‘in the pipeline’, their hard work and enthusiasm for innovation and redevelopment are evident.

From advancing their green energy strategy by placing solar panels on their indoor play area to a fossil dig and a steampunk-inspired restaurant in the Victorian walled garden, they are delighting thousands of visitors of all ages in Norfolk’s very own Jurassic Park.

About nor(DEV):biz

The aims of nor(DEV):biz (Norfolk Developers Business) are:

  • to be the go-to group for local businesses requiring a technology solution.
  • to facilitate and increase referrals and collaboration among Norfolk’s tech businesses.
  • to help close the digital skills gap.
  • to facilitate better collaboration between technology businesses and academic institutions.
  • to have a great meal with great company

Tickets prices do include a donation to the nor(DEV): chosen charity of the year, for 2019/2020.

Coding workshop example worksheets

Andy Balaam from Andy Balaam's Blog

This week we did a coding workshop exercise: 2 teams implemented the different sides of the SMPP protocol (without speaking to each other) and this morning we tried out connecting them together.

We successfully sent a message and received an acknowledgement!

It was a lot of fun and I we learned a surprising amount about SMPP (and quite how … interesting … the standard is).

In case they’re useful to anyone, here are the worksheets I made up: Team 1 ODT, Team 1 PDF, Team 2 ODT, Team 2 PDF.

Idea for a team who are less interested in SMPP (!) – try a similar exercise implementing FTP, which is a nice simple text-based protocol. I did this once and found it extremely rewarding.

Swarm algorithms

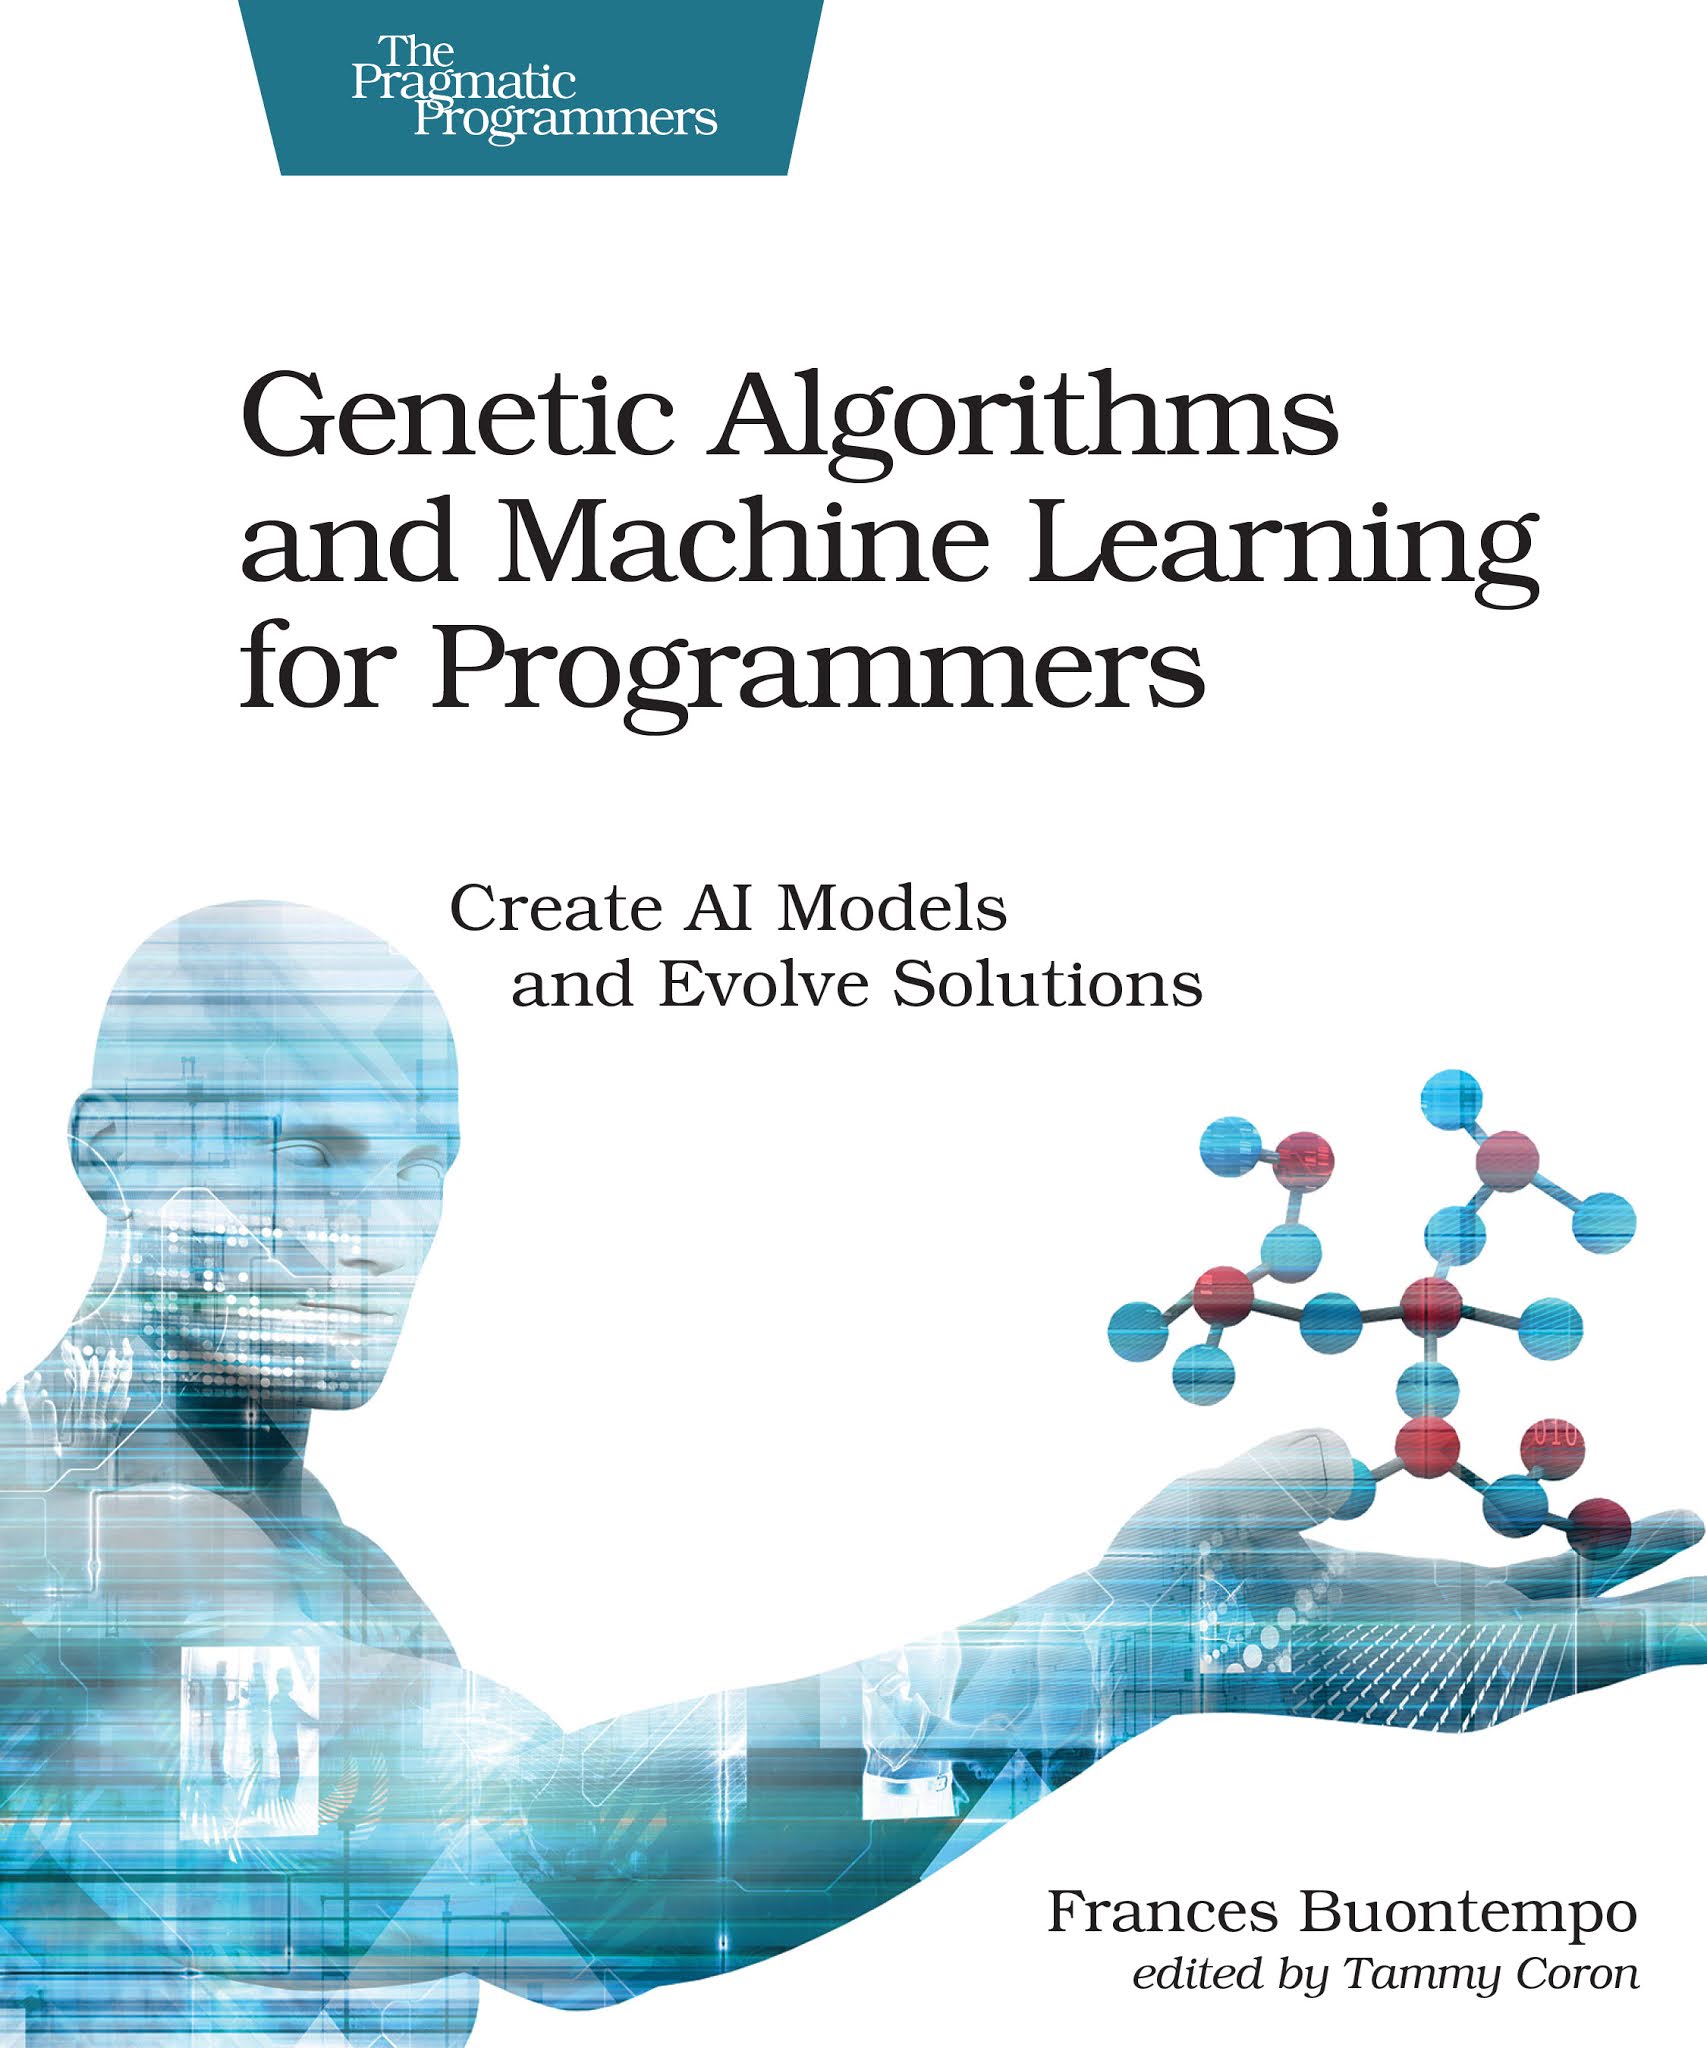
Fran from BuontempoConsulting

I wrote a book about about genetic algorithms and machine learning. You can buy it here.


Apart from genetic algorithms and other aspects of machine learning, it includes some swarm algorithms. Where a genetic algorithm mixes up potential solutions, by merging some together, and periodically mutates some values, swarm algorithms can be regarded as individual agents collaborating, each representing a solution to a problem, They can work together in various ways, giving rise to a variety of swarm algorithms.  

The so-called particle swarm algorithm can be used to find optimal solutions to problems. It's commonly referred to as a particle swarm optimisation, or PSO for short. PSO is often claimed to be based on the flocking behaviour of birds. Indeed, if you get the parameters right, you might see something similar to a flock of birds. PSO are similar to colony algorithms, which are also nature inspired, and also having agents collaborating to solve a problem.

Suppose you have some particles in a paper bag, say somewhere near the bottom. If they move about at random, some might get out of the bag in the end. If they follow each other, they might escape, but more likely than not, they'll hang round together in a gang. By providing a fitness function to encourage them, they can learn, for some definition of learn. Each particle can assess where it is, and remember the better places. The whole swarm will have a global best too. To escape a paper bag, we want the particles to go up. By inspecting the current (x, y) position, the fitness score can be the y-value. The bigger, the better. For real world problems, there can be many more than two dimensions, and the fitness function will require some thought. 

The algorithms is as follows:

    Choose n
    Initialize n particles randomly
    For a while:
        Update best global position
        Move particles
        Update each particle's best position and velocity

The particles' personal bests and the overall global best give the whole swarm a memory, of sorts. Initially, this is the starting position for each particle. In addition to the current position, each particle has a velocity, initialised with random numbers. Since we're doing this in two dimensions, the velocity has an x component, and a y component. To move a particle, update each of these by adding the velocity, v, in that direction to the current position:

    xt+1= xt + vx,t
    yt+1= yt + yx,t

Since the velocity starts at random, the particles move in various different directions to begin with.  The trick comes in when we update the velocity. There are several ways to do this. The standard way adds a fraction of the distance between the personal best and global best position for each particle and a proportion of the current velocity, kinda remembering where it was heading. This gives each a momentum along a trajectory, making it veer towards somewhere between its best spot and the global best spot. You'll need to pick the fractions. Using w, for weight, since we're doing a weighted sum, and c1 and c2 for the other proportions, we have:

    vx,t+1 = wvt + c1(pt-xt)+c2(gt-xt)

If you draw the particles moving around you will see them swarm, in this case out of the paper bag. 

This is one of many ways to code your way out of a paper bag covered in my book. When a particle solves a problem, here being out of the bag, inspecting the x and y values gives a solution to the problem. PSO can be used for a variety of numerical problems. It's usually described as a stochastic optimisation algorithm. That means it does something random (stochastic) to find the best (optimal) solution to a problem. You can read more here.  


Team DNA-impersonators create a business plan

Derek Jones from The Shape of Code

This weekend I was at the Hack the Police hackthon, sponsored by the Metropolitan Police+other organizations. My plan was to find an interesting problem to help solve, using the data we were told would be available. My previous experience with crime data is that there is not enough of it to allow reliable models to be built, this is a good thing in that nobody wants lots of crime. Talking to a Police intelligence officer, the publicly available data contained crimes (i.e., a court case had found somebody guilty), not reported incidents, and was not large enough to build allow a good model to be built.

Looking for a team to join, I got talking to Joe and Rebecca. Joe had discovered a very interesting possible threat to the existing DNA matching technique, and they were happy for me to join them analyzing this threat model; team DNA-impersonators was go.

Some background (Joe and Rebecca are the team’s genetic experts, I’m a software guy who has read a few books on the subject; all the mistakes in this post are mine). The DNA matching technique used by the Police is based on 17 specific sequences (each around 100 bases, known as loci), within the human genome (which contains around 3 billion bases).

There are companies who synthesize sequences of DNA to order. I knew that machines for doing this existed, but I did not know it was possible to order a bespoke sequence online, and how inexpensive it was.

Some people have had their DNA sequenced, and have allowed it to be published online; Steven Pinker is the most famous person I could find, whose DNA sequence is available online (link not given; it requires work+luck to find). The Personal Genome Projects aims to sequence and make available the complete genomes of 100,000 volunteers (the UK arm of this project is on hold because of lack of funding; master criminals in the UK have a window of opportunity: offer to sponsor the project on condition that their DNA is included in the public data set).

How much would it cost to manufacture bottles of spray-on Steven Pinker DNA? Is there a viable business model selling Pinker No. 5?

The screen shot below shows a quote for 2-nmol of DNA for the sequence of 100 bases that are one of the 17 loci used in DNA matching. This order is for concentrated DNA, and needs to be diluted to the level likely to be found as residue at a crime scene. Joe calculated that 2-nmol can be diluted to produce 60-liters of usable ‘product’.

Quote for synthesis of 100 bases of human DNA.

There was not enough time to obtain sequences for the other 16-loci, and get quotes for them. Information on the 17-loci used for DNA matching is available in research papers; a summer job for a PhD student to sort out the details.

The concentrate from the 17-loci dilutes to 60-liters. Say each spray-on bottle contains 100ml, then an investment of £800 (plus researcher time) generates enough liquid for 600-bottles of Pinker No. 5.

What is the pricing model? Is there a mass market (e.g., Hong Kong protesters wanting to be anonymous), or would it be more profitable to target a few select clients? Perhaps Steven Pinker always wanted to try his hand at safe-cracking in his spare time, but was worried about leaving DNA evidence behind; he might be willing to pay to have the market flooded, so Pinker No. 5 residue becomes a common occurrence at crime scenes (allowing him to plausible claim that any crime scene DNA matches were left behind by other people).

Some of the police officers at the hack volunteered that they knew lots of potential customers; the forensics officer present was horrified.

Before the 1980s, DNA profiling was not available. Will the 2020s be the decade in which DNA profiling ceases being a viable tool for catching competent criminals?

High quality photocopiers manufacturers are required to implement features that make it difficult for people to create good quality copies of paper currency.

What might law enforcement do about this threat to the viability of DNA profiling?

Ideas include:

  • Requiring companies in the bespoke DNA business to report suspicious orders. What is a suspicious order? Are enough companies in business to make it possible to order each of the 17-loci from different company (we think so)?
  • Introducing laws making it illegal to be in possession of diluted forms of other people’s DNA (with provisions for legitimate uses).
  • Attacking the economics of the Pinker No. 5 business model by having more than 17-loci available for use in DNA matching. Perhaps 1,000 loci could be selected as potential match sites, with individual DNA testing kits randomly testing 17 (or more) from this set.

New books and cards – stuff happening

Allan Kelly from Allan Kelly Associates

RetroCardsLores-2019-09-13-16-51.jpg

I am sure some of you have noticed that my blogs have been a less regular the last few months. That is because I’ve been busy on other stuff. So a break from deep thoughts and advice on the software world to mention some other stuff I’ve been working on.

UserStories_Audio-2019-09-13-16-51.jpg
For a start, available right now, my Little Book of Requirements and User Stories is now available in audio format to listen to. Full details – and the FAQ as a free download on my website. You will find links there to buy it on Audible and Apple (its cheaper on Apple, don’t ask me why.)

To my surprise Little Book has long been my best-seller so I teamed up again with Stacy Gonzalez – who voiced Project Myopia for me – to produce an audio version of Little Book. In the few weeks it has been available sales are already outstripping Project Myopia!

AOPO-2019-09-13-16-51.jpg

Second, as some know I’ve been working with Apress to turn The Art of Product Ownership from a LeanPub eBook into a full regular book. That should be out in October, you can pre-order it on Amazon now.

(And if you can’t wait, I’ve got a pre-copy edit version I can share with you provided you promise to write an Amazon review when the book is published. Mail me or use the contact form if you are interested.)

Finally, that picture at the top of the page. I’ve been working with Nicolas Umiastowski to create a playing card retrospective. These are based on my Retrospective Dialogue Sheets In our experiments they have given retrospectives another twist. More about these soon – and details of how you can get a pack (in the mean time get in contact if you are really keen to try them.)


Like this post? – Like to receive these posts by e-mail?

Subscribe to my newsletter & receive a free eBook “Xanpan: Team Centric Agile Software Development”

Check out my latest books – Continuous Digital and Project Myopia – and the Project Myopia audio edition

The post New books and cards – stuff happening appeared first on Allan Kelly Associates.

Natural elimination, or the survival of the good enough

Derek Jones from The Shape of Code

Thanks to Darwin, the world is full of people who think that evolution, in nature, works by: natural selection, or the survival of the fittest. I thought this until I read “Good Enough: The Tolerance for Mediocrity in Nature and Society” by Daniel Milo.

Milo makes a very convincing case that nature actually works by: natural elimination, or the survival of the good enough.

Why might Darwin have gone with natural selection in his book, On the Origin of Species? Milo makes the point that the only real evidence that Darwin had to work with was artificial selection, that is the breeding of farm animals and domestic pets to select for traits that humans found desirable. Darwin’s visit to the Galápagos islands triggered a way of thinking, it did not provide him with the evidence he needed; Darwin’s Finches have become a commonly cited example of natural selection at work, but while Darwin made the observations it was not until 80 years later that somebody else spotted their relevance.

The Origin of Species, or to use its full title: “On the Origin of Species by means of natural selection, or the preservation of favored races in the struggle for life.” is full of examples and terminology relating to artificial selection.

Natural selection, or natural elimination, isn’t the result the same?

Natural selection implies an optimization process, e.g., breeders selecting for a strain of cows that produce the most milk.

Natural elimination is a good enough process, i.e., a creature needs a collection of traits that are good enough for them to create the next generation.

A long-standing problem with natural selection is that it fails to explain the diversity present in a natural population of some breed of animal (there is very little diversity in each breed of farm animal, they have been optimized for consistency). Diversity is not a problem for natural elimination, which does not reduce differences in its search for fitness.

The diversity produced as a consequence of natural elimination creates a population containing many neutral traits (i.e., characteristics that have no positive or negative impact on continuing survival). When a significant change in the environment occurs, one or more of the neutral traits may suddenly have positive or negative survival consequences; the creatures with the positive traits have opportunity time to adapt to the changed environment. A population whose members possess a diverse range of neutral traits has a higher chance of long-term survival than a population where diversity has been squeezed in the quest for the fittest.

I think that natural elimination also applies within software ecosystems. Commercial products survive if enough customers buy them, software developers need good enough know-how to get the job done.

I’m sure customers would prefer software ecosystems to operate on the principle of survival of the fittest (it reduces their costs). Over the long term is society best served by diverse software ecosystems or softwaremonocultures? Diversity is a way of encouraging competition, but over time there is diminishing returns on the improvements.

Cut Price Clusterings – a.k.

a.k. from thus spake a.k.

Last month we saw how we could efficiently generate hierarchical clusterings, which are sequences of sets of clusters, which are themselves subsets of a set of data that each contain elements that are similar to each other, such that if a pair of data are in the same clustering at one step then they must be in the same clustering in the next which will always be the case if we move from one step to the next by merging the closest pairs of clusters. Specifically, we used our ak.minHeap implementation of the min-heap structure to cache the distances between clusters, saving us the expense of recalculating them for clusters that don't change from one step in the hierarchy to the next.
Recall that we used three different schemes for calculating the distance between a pair of clusters, the average distance between their members, known as average linkage, the distance between their closest members, known as single linkage, and the distance between their farthest members, known as complete linkage, and that I concluded by noting that our algorithm was about as efficient as possible in general but that there is a much more efficient scheme for single linkage clusterings; efficient enough that sorting the clusters in each clustering by size would be the most costly operation and so in this post we shall implement objects to represent clusterings that don't do that.