Where are we with models of human learning?

Derek Jones from The Shape of Code

Learning is an integral part of writing software. What have psychologists figured out about the characteristics of human learning?

A study of memory, published in 1885, kicked off the start of modern psychology research. At the start of the 1900s, learning research was still closely tied to the study of the characteristics of what we now call working memory, e.g., measuring the time taken for subjects to correctly recall sequences of digits, nonsense syllables, words and prose. By the 1930s, learning was a distinct subject in its own right.

What is now known as the power law of learning was first proposed in 1926. Wikipedia is right to use the phrase power law of practice, since it is some measure of practice that appears in the power law of learning equation: T=a+b*P^{-c}, where: T is the time taken to do the task,P is some measure of practice (such as the number of times the subject has performed the task), and a, b, and c are constants fitted to the data.

For the next 70 years some form of power law did a good job of fitting the learning data produced by researchers. Then in 1997 a paper pointed out that researchers were fitting aggregate data (i.e., one equation fitted to all subject data), and that an exponential equation was a better fit to individual subject response times: T=a+b*e^{-cP}. The power law appeared to be the result of aggregating the exponential response performance of multiple subjects; oops.

What is the situation today, 25 years later? Do the subsystems of our brains produce a power law or exponential improvement in performance, with practice?

The problem with answering this question is that both equations can fit the available data quite well, with one being a technically better fit than the other for different datasets. The big difference between the two equations is in their tails, however, it is costly and time-consuming to obtain enough data to distinguish between them in this region.

When discussing learning in my evidence-based software engineering book, I saw no compelling reason to run counter to the widely cited power law, but I did tell readers about the exponential fit issue.

Studies of learnings have tended to use simple tasks; subjects are usually only available for a short time, and many task repetitions are needed to model the impact of learning. Simple tasks tend to be dominated by one primary activity, which means that subjects can focus their learning on this one activity.

Complicated tasks involve many activities, each potentially providing distinct learning opportunities. Which activities will a subject focus on improving, will the performance on one activity improve faster than others, will the approach chosen for one activity limit the performance on a second activity?

For a complicated task, the change in performance with amount of practice could be a lot more complicated than a single power law/exponential equation, e.g., there may be multiple equations with each associated with one or more activities.

In the previous paragraph, I was careful to say “could be a lot more complicated”. This is because the few datasets of organizational learning show a power law performance improvement, e.g., from 1936 we have the most cited study Factors Affecting the Cost of Airplanes, and the less well known but more interesting Liberty shipbuilding from the 1940s.

If the performance of something involving multiple people performing many distinct activities follows a power law improvement with practice, then the performance of an individual carrying out a complicated task might follow a simple equation; perhaps the combined form of many distinct simple learning activities is a simple equation.

Researchers are now proposing more complicated models of learning, along with fitting them to existing learning datasets.

Which equation should software developers use to model the learning process?

I continue to use a power law. The mathematics tend to be straight-forward, and it often gives an answer that is good enough (because the data fitted contains lots of variance). If it turned out that an exponential would be easier to work with, I would be happy to switch. Unless there is a lot of data in the tail, the difference between power law/exponent is usually not worth worrying about.

There are situations where I have failed to successfully add a learning (power law) component to a model. Was this because there was no learning present, or was the learning not well-fitted by a power law? I don’t know, and I cannot think of an alternative equation that might work, for these cases.

How large an impact does social conformity have on estimates?

Derek Jones from The Shape of Code

People experience social pressure to conform to group norms. How big an impact might social pressure have on a developer’s estimate of the effort needed to implement some functionality?

If a manager suggests that the effort likely to be required is large/small, I would expect a developer to respond accordingly (even if the manager is thought to be incompetent; people like to keep their boss happy). Of course, customer opinions are also likely to have an impact, but what about fellow team members, or even the receptionist. Until somebody runs the experiments, we are going to have to do with non-software related tasks.

A study by Molleman, Kurversa, and van den Bos asked subjects (102 workers on Mechanical Turk) to estimate the number of animals in an image (which contained between 50 and 100 ants, flamingos, bees, cranes or crickets). Subjects were given 30 seconds to respond, and after typing their answer they were told that “another participant had estimated X“, and given 45 seconds to give a second estimate. The ‘social pressure’ estimate, X, was chosen to be around 15-25% larger/smaller than the estimate given (values from a previous experiment were randomly selected).

The plot below shows the number of second estimates where there was a given percentage change between the first and second estimates, red line is a loess fit; the formula used is {secondEstimate-firstEstimate}/{SocialEstimate-firstEstimate} (code+data):

Number of second estimates having a given change in the first estimate towards social estimate.

Around 25% of second estimates were unchanged, and 2% were changed to equal the social estimate. In two cases the second estimate was less than the first, and in eleven cases it was larger than the social estimate. Both the mean and median for shift towards the social estimate were just over 30% of the difference between the first estimate and the social estimate.

As with previous estimating studies, a few round numbers were often chosen. I was interested in finding out what impact the use of a round number value for the first estimate, or the social estimate, might have on the change in estimated value. The best regression model I could find showed that if the first estimate was exactly divisible by 5 (or 10), then the second estimate was likely to be around 5% larger. In fact divisible-by-5 was the only variable that had any predictive power.

My initial hypothesis was that the act of choosing a round numbers is an expression of uncertainty, and that this uncertainty increases the impact of the social estimate (when making the second estimate). An analysis of later experiments suggested that this pattern was illusionary (see below).

Modelling estimate values, rather than their differences, the equation: secondEstimate approx firstEstimate^{0.6}*SocialEstimate^{0.3} explains nearly all the variance present in the data.

Two weeks after the first experiment, all 102 subjects were asked to repeat the experiment (they each saw the same images, in the same order, and social estimates as in the first study); 69 subjects participated. Nine months after the first experiment, subjects were asked to repeat the experiment again; 47 subjects participated, again with each subject seeing the same images in the same order, and social estimates. Thirty-five subjects participated in all three experiments.

To what extent were subjects consistently influenced by the social estimate, across three identical sessions? The Pearson correlation coefficient between both the first/second experiment, and the first/third experiment, was around 0.6.

The impact of round numbers was completely different, i.e., no impact on the second, and a -7% impact on the third (i.e., a reduced change). So much for my initial hypothesis.

The exponents in the above equation did not change much for the data from the second and third reruns of the experiment.

The variability in the social estimates used in these experiments, involving image contents, differs from software estimates in that they were only 12-25% different from the first estimate. Software estimates often differ by significantly larger amounts (in fact, a 12% difference would probably be taken as agreement).

With some teams, people meet to thrash out a team estimate. Data is sometimes available on the final estimate, but data on the starting values is very hard to come by. Pointers to experiments where social estimates are significantly different (i.e., greater than 50%) from the ones given by subjects welcome.

The Approximate Number System and software estimating

Derek Jones from The Shape of Code

The ability to perform simple numeric operations can improve the fitness of a creature (e.g., being able to select which branch contains the most fruit), increasing the likelihood of it having offspring. Studies have found that a wide variety of creatures have a brain subsystem known as the Approximate Number System (ANS).

A study by Mechner rewarded rats with food, if they pressed a lever N times (with N taking one of the values 4, 8, 12 or 16), followed by pressing a second lever. The plot below shows the number of lever presses made before pressing the second lever, for a given required N; it suggests that the subject rat is making use of an approximate number system (code+data):

Daily article counts for blog.

Humans have a second system for representing numbers, which is capable of exact representation, it is language. The Number Sense by Stanislas Dehaene was on my list of Christmas books for 2011.

One method used to study the interface between the two language systems, available to humans, involves subjects estimating the number of dots in a briefly presented image. While reading about one such study, I noticed that some of the plots showed patterns similar to the patterns seen in plots of software estimate/actual data. I emailed the lead author, Véronique Izard, who kindly sent me a copy of the experimental data.

The patterns I was hoping to see are those invariably seen in software effort estimation data, e.g., a power law relationship between actual/estimate, consistent over/under estimation by individuals, and frequent use of round numbers.

Psychologists reading this post may be under the impression that estimating the time taken to implement some functionality, in software, is a relatively accurate process. In practice, for short tasks (i.e., under a day or two) the time needed to form a more accurate estimate makes a good-enough estimate a cost-effective option.

This Izard and Dehaene study involved two experiments. In the first experiment, an image containing between 1 and 100 dots was flashed on the screen for 100ms, and subjects then had to type the estimated number of dots. Each of the six subjects participated in five sessions of 600 trials, with each session lasting about one hour; every number of dots between 1 and 100 was seen 30 times by each subject (for one subject the data contains 1,783 responses, other subjects gave 3,000 responses). Subjects were free to type any value as their estimate.

These kinds of studies have consistently found that subject accuracy is very poor (hardly surprising, given that subjects are not provided with any feedback to help calibrate their estimates). But since researchers are interested in patterns that might be present in the errors, very low accuracy is not an issue.

The plot below shows stimulus (number of dots shown) against subject response, with green line showing Response==Stimulus
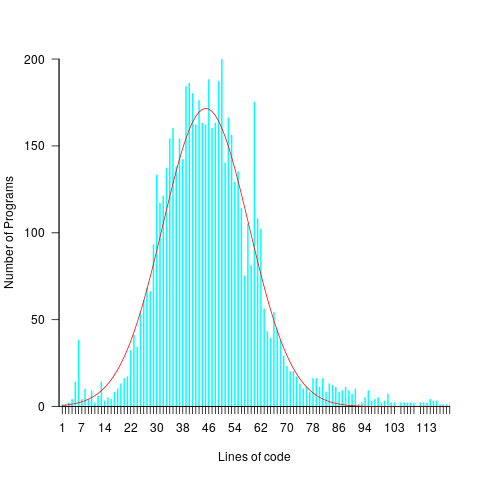
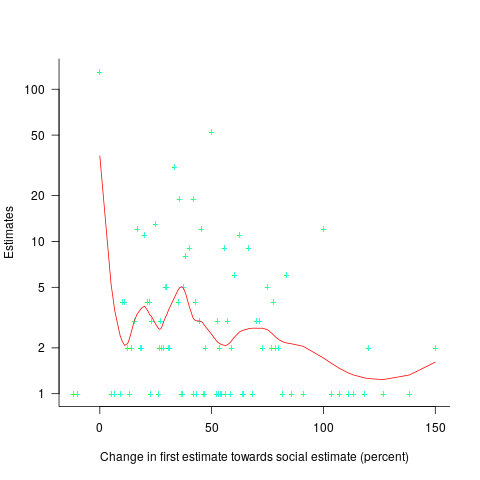
, and red line a fitted regression model having the form Response=1.7*Stimulus^{0.7} (which explains just over 70% of the variance;
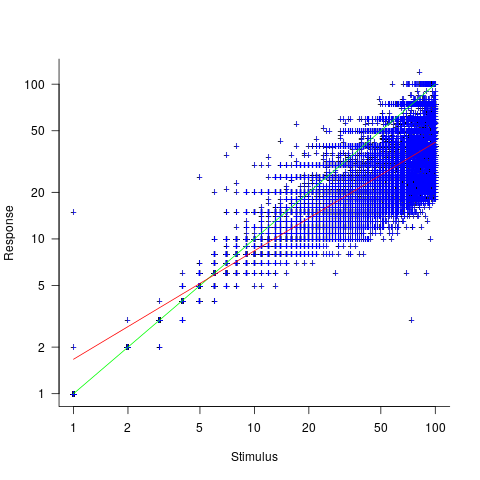
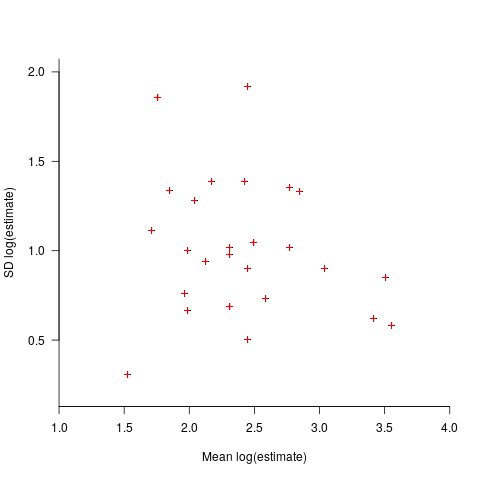
 code+data):

Response given for given number of stimulus dots, with fitted regression model.

Just like software estimates, there is a good fit to a power law, and the only difference in accuracy performance is that software estimates tend not to be so skewed towards underestimating (i.e., there are a lot more low accuracy overestimates).

Adding subjectID to the model gives: Response=1.8*Stimulus^{0.7}*SubjectID, with SubjectID varying between 0.65 and 1.57; more than a factor of two difference between subjects (this model explains just under 90% of the variance). This is a smaller range than the software estimation data, but with only six subjects there was less chance of a wider variation (code+data).

The software estimation data finds shows that accuracy does not improve with practice. The experimental subjects were not given any feedback, and would not be expected to improve, but does the strain of answering so many questions cause them to get worse? Adding trial number to the model suggests a 12% increase in underestimation, over 600 trials. However, adding an interaction with SubjectID shows that the performance of two subjects remains unchanged, while two subjects experience a 23% increase in underestimation.

The plot below shows the number of times each response was given, combining all subjects, with commonly given responses in red (code+data):

Number of occurrences of response values, over all subjects.

The commonly occurring values that appear in software estimation data are structured as fractions of units of time, e.g., 0.5 hours, or 1 hour or 1 day (appearing in the data as 7 hours). The only structure available to experimental subjects was subdivisions of powers of 10 (i.e., 10 and 100).

Analysing the responses by subject shows that each subject had their own set of preferred round numbers.

To summarize: The results from an experiment investigating the interface between the two human number systems contains three patterns seen in software estimation data, i.e., power law relationship between actual and estimate, individual differences in over/underestimating, and extensive use of round numbers.

Izard’s second experiment limited response values to prespecified values (i.e., one to 10 and multiples of 10), and gave a calibration example after each block of 46 trials. The calibration example improved performance, and the use of round numbers as prespecified response values had the effect of removing spikes from the response counts (which were relatively smooth; code+data)).

We now have circumstantial evidence that software developers are using the Approximate Number System when making software estimates. We will have to wait for brain images from a developer in an MRI scanner, while estimating a software task, to obtain more concrete proof that the ANS is involved in the process. That is, are the areas of the brain thought to be involved in the ANS (e.g., the intraparietal sulcus) active during software estimation?

Readability: a scientific approach

Derek Jones from The Shape of Code

Readability, as applied to software development today, is a meaningless marketing term. Readability is promoted as a desirable attribute, and is commonly claimed for favored programming languages, particular styles of programming, or ways of laying out source code.

Whenever somebody I’m talking to, or listening to in a talk, makes a readability claim, I ask what they mean by readability, and how they measured it. The speaker invariably fumbles around for something to say, with some dodging and weaving before admitting that they have not measured readability. There have been a few studies that asked students to rate the readability of source code (no guidance was given about what readability might be).

If somebody wanted to investigate readability from a scientific perspective, how might they go about it?

The best way to make immediate progress is to build on what is already known. There has been over a century of research on eye movement during reading, and two model of eye movement now dominate, i.e., the E-Z Reader model and SWIFT model. Using eye-tracking to study developers is slowly starting to be adopted by researchers.

Our eyes don’t smoothly scan the world in front of us, rather they jump from point to point (these jumps are known as a saccade), remaining fixed long enough to acquire information and calculate where to jump next. The image below is an example from an eye tracking study, where subjects were asking to read a sentence (see figure 770.11). Each red dot appears below the center of each saccade, and the numbers show the fixation time (in milliseconds) for that point (code):

Saccade points in a sentence, and fixation times.

Models of reading are judged by the accuracy of their predictions of saccade landing points (within a given line of text), and fixation time between saccades. Simulators implementing the E-Z Reader and SWIFT models have found that these models have comparable performance, and the robustness of these models are compared by looking at the predictions they make about saccade behavior when reading what might be called unconventional material, e.g., mirrored or scarmbeld text.

What is the connection between the saccades made by readers and their understanding of what they are reading?

Studies have found that fixation duration increases with text difficulty (it is also affected by decreases with word frequency and word predictability).

It has been said that attention is the window through which we perceive the world, and our attention directs what we look at.

A recent study of the SWIFT model found that its predictions of saccade behavior, when reading mirrored or inverted text, agreed well with subject behavior.

I wonder what behavior SWIFT would predict for developers reading a line of code where the identifiers were written in camelCase or using underscores (sometimes known as snake_case)?

If the SWIFT predictions agreed with developer saccade behavior, a raft of further ‘readability’ tests spring to mind. If the SWIFT predictions did not agree with developer behavior, how might the model be updated to support the reading of lines of code?

Until recently, the few researchers using eye tracking to investigate software engineering behavior seemed to be having fun playing with their new toys. Things are starting to settle down, with some researchers starting to pay attention to existing models of reading.

What do I predict will be discovered?

Lots of studies have found that given enough practice, people can become proficient at handling some apparently incomprehensible text layouts. I predict that given enough practice, developers can become equally proficient at most of the code layout schemes that have been proposed.

The important question concerning text layout, is: which one enables an acceptable performance from a wide variety of developers who have had little exposure to it? I suspect the answer will be the one that is closest to the layout they have had the most experience,i.e., prose text.

Cognitive bias or not paying enough attention?

Derek Jones from The Shape of Code

Assume you are responsible for two teams who independently work on projects, say Team A and Team B. The teams have different work completion rates, with Team A completing work at the rate of 70 widgets per week, while Team B completes 30 widgets per week. Both teams always work on projects that require the completion of the same number of widgets.

You have the resources to send just one of the teams on a course. It is predicted that sending Team A on the course would improve their performance to 110 widgets per week, while attending the course would improve the performance of Team B to 40 widgets per week.

Senior management have decreed that time to market is the metric by which project managers are judged.

You want to impress senior management by significantly improving time to market for your projects; which team do you send on the course (i.e., the one that is likely to experience the largest reduction in time to market)?

This question is a restatement of a one involving cars travelling at different speeds, that has grown into a niche research area. Studies have found that a large percentage of subjects give the wrong answer, and they are said to have a time-saving bias, or time-loss bias.

The inability to correctly process “inverse variables” has been given as the reason people tend to give the wrong answer. The term “inverse variables” comes from the formula for calculating completion time, where the velocity appears as the denominator. Another way of looking at this problem is that when going slowly, there is more scope for improvement, compared to when going much faster.

A speed increase from 30 to 40 is only 10, or a 33% improvement; while an increase from 70 to 110 is an increase of 40, or 57%. Based on these numbers, Team A should be sent on the course.

However, we are interested in time to market. Let’s assume that both teams have to complete a project requiring 100 widgets. Before attending the course, Team A completes 100 widgets in 100/70=1.4 weeks, and Team B completes 100 widgets in 100/30=3.3 weeks. After attending the course, Team A would complete 100 widgets in 100/110=0.91 weeks, and Team B would complete 100 widgets in 100/40=2.5 weeks. Time to market for Team A has been reduced by (1.4-0.9)=0.5 weeks, while the reduction for Team B is (3.3-2.5)=0.8 weeks. So sending Team B on the course makes you look better, on the time to market metric.

If somebody ran an experiment with project managers, would the subjects tend to incorrectly process “inverse variables”. Well, somebody has done the experiment, and yes, many subjects exhibited the time-saving bias (the experimental scenario described in the appendix is a lot easier to understand than the one in the main body of the paper, which is a mess; Magne Jørgensen continues to be the only person doing interesting experiments in software estimation).

It has become common practice that, when a large percentage of subjects in a psychology experiment respond in ways that are inconsistent with a mathematical approach, the behavior is labelled as being a bias. I think the use of this terminology makes the behavior sound more interesting than it actually is; what’s wrong with saying that people make mistakes. Perhaps labelling experimental responses as being a bias makes it easier to get papers published.

Whether people are biased, or don’t pay enough attention, when solving non-trivial equations, what might be done about it?

This is not about whether any particular metric is a useful one, rather it is about calculating the right answer for whatever metric happens to be chosen.

Would an awareness campaign highlighting the problems people have with “inverse variables” be worthwhile? I don’t think so. Many people have problems with equations, and I don’t see why this case is more worthy of being highlighted than any other.

Am I missing something?

Psychology researchers are interested in figuring out the functioning of the brain/mind, so they are looking for patterns in the responses subjects give. Once someone has published a few papers on a research topic, they become invested in it. If they continue to get funding, the papers keep on coming. Sometimes a niche topic acquires a major following, and the work contributes to a major change of thinking about the mind, e.g., the Wason selection task helped increase the evidence that culture has an impact on cognitive behavior.

I think that software engineering researchers need to carefully evaluate the likely importance of behaviors that psychology researchers have labelled as a bias.

Impact of native language on variable naming

Derek Jones from The Shape of Code

When creating a variable name, to what extent are developers influenced by their native human language?

There is lots of evidence that variable names are either English words, abbreviations of English words, or some combination of these two. Source code containing a large percentage of identifiers using words from other languages does exist, but it requires effort to find; there is a widely expressed view that source should be English based (based on my experience of talking to non-native English speakers, and even the odd paper discussing the issue, e.g., Language matters).

Given that variable names can prove information that reduces the effort needed to understand code, and that most code is only ever read by the person who wrote it, developers should make the most of their expertise in using their native language.

To what extent do non-native English-speaking developers make use of their non-English native language?

I have found it very difficult to even have a discussion around this question. When I broach the subject with non-native English speakers, the response is often along the lines of “our develo0pers speak good English.” I am careful to set the scene by telling them of my interest in naming, and that I think there are benefits for developers to make use of their native language. The use of non-English languages in software development is not yet a subject that is open for discussion.

I knew that sooner or later somebody would run an experiment…

How Developers Choose Names is another interesting experiment involving Dror Feitelson (the paper rather confusingly refers to it as a survey, a post on an earlier experiment).

What makes this experiment interesting is that bilingual subjects (English and Hebrew) were used, and the questions were in English or Hebrew. The 230 subjects (some professional, some student) were given a short description and asked to provide an appropriate variable/function/data-structure name; English was used for 26 of the question, and Hebrew for the other 21 questions, and subjects answered a random subset.

What patterns of Hebrew usage are present in the variable names?

Out of 2017 answers, 14 contained Hebrew characters, i.e., not enough for statistical analysis. This does not mean that all the other variable names were only derived from English words, in some cases Hebrew words appeared via transcription using the 26 English letters. For instance, using “pinuk” for the Hebrew word that means “benefit” in English. Some variables were created from a mixture of Hebrew and English words, e.g., deservedPinuks and pinuksUsed.

Analysing this data requires someone who is fluent in Hebrew and English. I am not a fluent, or even non-fluent, Hebrew speaker. My role in this debate is encouraging others, and at last I have some interesting data to show people.

The paper spends time showing how for personal preferences result in a wide selection of names being chosen by different people for the same quantity. I cannot think of any software engineering papers that have addressed this issue for variable names, but there is lots of evidence from other fields; also see figure 7.33.

Those interested in searching source code for the impact of native-language might like to look at the names of variables appearing as operands of the bitwise and logical operators. Some English words occur much more frequently in the names of these variable, compared to variables that are operands of arithmetic operators, e.g., flag, status, and signal. I predict that non-native English-speaking developers will make use of corresponding non-English words.

Estimate variability for the same task

Derek Jones from The Shape of Code

If 100 people estimate the time needed to implement a feature, in software, what is the expected variability in the estimates?

Studies of multiple implementations of the same specification suggest that standard deviation of the mean number of lines across implementations is 25% of the mean (based on data from 10 sets of multiple implementations, of various sizes).

The plot below shows lines of code against the number of programs (implementing the 3n+1 problem) containing that many lines (code and data):

3n+1 programs containing various lines of code.

Might any variability in the estimates for task implementation be the result of individuals estimating their own performance (which is variable)?

To the extent that an estimate is based on a person’s implementation experience, a developer’s past performance will have some impact on their estimate. However, studies have found a great deal of variability between individual estimates and their corresponding performance.

One study asked 14 companies to bid on implementing a system (four were eventually chosen to implement it; see figure 5.2 in my book). The estimated elapsed time varied by a factor of ten. Until the last week this was the only study of this question for which the data was available (and may have been the only such study).

A study by Alhamed and Storer investigated crowd-sourcing of effort estimates, structured by use of planning poker. The crowd were workers on Amazon’s Mechanical Turk, and the tasks estimated came from the issue trackers of JBoss, Apache and Spring Integration (using issues that had been annotated with an estimate and actual time, along with what was considered sufficient detail to make an estimate). An initial set of 419 issues were whittled down to 30, which were made available, one at a time, as a Mechanical Turk task (i.e., only one issue was available to be estimated at any time).

Worker estimates were given using a time-based category (i.e., the values 1, 4, 8, 20, 40, 80), with each value representing a unit of actual time (i.e., one hour, half-day, day, half-week, week and two weeks, respectively).

Analysis of the results from a pilot study were used to build a model that detected estimates considered to be low quality, e.g., providing a poor justification for the estimate. These were excluded from any subsequent iterations.

Of the 506 estimates made, 321 passed the quality check.

Planning poker is an iterative process, with those making estimates in later rounds seeing estimates made in earlier rounds. So estimates made in later rounds are expected to have some correlation with earlier estimates.

Of the 321 quality check passing estimates, 153 were made in the first-round. Most of the 30 issues have 5 first-round estimates each, one has 4 and two have 6.

Workers have to pick one of five possible value as their estimate, with these values being roughly linear on a logarithmic scale, i.e., it is not possible to select an estimate from many possible large values, small values, or intermediate values. Unless most workers pick the same value, the standard deviation is likely to be large. Taking the logarithm of the estimate maps it to a linear scale, and the plot below shows the mean and standard deviation of the log of the estimates for each issue made during the first-round (code+data):

Mean against standard deviation for log of estimates of each issue.

The wide spread in the standard deviations across a spread of mean values may be due to small sample size, or it may be real. The only way to find out is to rerun with larger sample sizes per issue.

Now it has been done once, this study needs to be run lots of times to measure the factors involved in the variability of developer estimates. What would be the impact of asking workers to make hourly estimates (they would not be anchored by experimenter specified values), or shifting the numeric values used for the categories (which probably have an anchoring effect)? Asking for an estimate to fix an issue in a large software system introduces the unknown of all kinds of dependencies, would estimates provided by workers who are already familiar with a project be consistently shifted up/down (compared to estimates made by those not familiar with the project)? The problem of unknown dependencies could be reduced by giving workers self-contained problems to estimate, e.g., the 3n+1 problem.

The crowdsourcing idea is interesting, but I don’t think it will scale, and I don’t see many companies making task specifications publicly available.

To mimic actual usage, research on planning poker (which appears to have non-trivial usage) needs to ensure that the people making the estimates are involved during all iterations. What is needed is a dataset of lots of planning poker estimates. Please let me know if you know of one.

Software engineering experiments: sell the idea, not the results

Derek Jones from The Shape of Code

A new paper investigates “… the feasibility of stealthily introducing vulnerabilities in OSS via hypocrite commits (i.e., seemingly beneficial commits that in fact introduce other critical issues).” Their chosen Open source project was the Linux kernel, and they submitted three patches to the kernel review process.

This interesting idea blew up in their faces, when the kernel developers deduced that they were being experimented on (they obviously don’t have a friend on the inside). The authors have come out dodging and weaving.

What can be learned by reading the paper?

Firstly, three ‘hypocrite commits’ is not enough submissions to do any meaningful statistical analysis. I suspect it’s a convenience sample, a common occurrence in software engineering research. The authors sell three as a proof-of-concept.

How many of the submitted patches passed the kernel review process?

The paper does not say. The first eight pages provide an introduction to the Open source development model, the threat model for introducing vulnerabilities, and the characteristics of vulnerabilities that have been introduced (presumably by accident). This is followed by 2.5 pages of background and setup of the experiment (labelled as a proof-of-concept).

The paper then switches (section VII) to discussing a different, but related, topic: the lifetime of (unintended) vulnerabilities in patches that had been accepted (which I think should have been the topic of the paper. This interesting discussion is 1.5 pages; also see The life and death of statically detected vulnerabilities: An empirical study, covered in figure 6.9 in my book.

The last two pages discuss mitigation, related work, and conclusion (“…a proof-of-concept to safely demonstrate the practicality of hypocrite commits, and measured and quantified the risks.”; three submissions is not hard to measure and quantify, but the results are not to be found in the paper).

Having the paper provide the results (i.e., all three commits spotted, and a very negative response by those being experimented on) would have increased the chances of negative reviewer comments.

Over the past few years I have started noticing this kind of structure in software engineering papers, i.e., extended discussion of an interesting idea, setup of experiment, and cursory or no discussion of results. Many researchers are willing to spend lots of time discussing their ideas, but are unwilling to invest much time in the practicalities of testing them. Some reviewers (who decide whether a paper is accepted to publication) don’t see anything wrong with this approach, e.g., they accept these kinds of papers.

Software engineering research remains a culture of interesting ideas, with evidence being an optional add-on.