Maximum team size before progress begins to stall

Derek Jones from The Shape of Code

On multi-person projects people have to talk to each other, which reduces the amount of time available for directly working on writing software. How many people can be added to a project before the extra communications overhead is such that the total amount of code, per unit time, produced by the team decreases?

A rarely cited paper by Robert Tausworthe provides a simple, but effective analysis.

Activities are split between communicating and producing code.

If we assume the communications overhead is give by: t_0(S^{alpha}-1), where t_0 is the percentage of one person’s time spent communicating in a two-person team, S the number of developers and alpha a constant greater than zero (I’m using Tausworthe’s notation).

The maximum team size, before adding people reduces total output, is given by: S=({1+t_0}/{(1+alpha)t_0})^{1/{alpha}}.

If alpha=1 (i.e., everybody on the project has the same communications overhead), then S={1+t_0}/{2t_0}, which for small t_0 is approximately S=1/{2t_0}. For example, if everybody on a team spends 10% of their time communicating with every other team member: S={1+0.1}/{2*0.1}approx 5.

In this team of five, 50% of each persons time will be spent communicating.

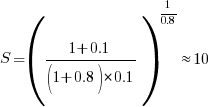
If alpha=0.8, then we have S=({1+0.1}/{(1+0.8)*0.1})^{1/0.8}approx 10.

What if the percentage of time a person spends communicating with other team members has an exponential distribution? That is, they spend most of their time communicating with a few people and very little with the rest; the (normalised) communications overhead is: 1-e^{-(S-1)t_1}, where t_1 is a constant found by fitting data from the two-person team (before any more people are added to the team).

The maximum team size is now given by: S=1/{t_1}, and if t_1=0.1, then: S=1/{0.1}=10.

In this team of ten, 63% of each persons time will be spent communicating (team size can be bigger, but each member will spend more time communicating compared to the linear overhead case).

Having done this analysis, what is now needed is some data on the distribution of individual communications overhead. Is the distribution linear, square-root, exponential? I am not aware of any such data (there is a chance I have encountered something close and not appreciated its importance).

I have only every worked on relatively small teams, and am inclined towards the distribution of time spent communicating not being constant. Was it exponential or a power-law? I would not like to say.

Could a communications time distribution be reverse engineered from email logs? The cc’ing of people who might have an interest in a topic complicates the data analysis; time spent in meetings are another complication.

Pointers to data most welcome and as is any alternative analysis using data likely to have a higher signal/noise ratio.

StatsModels: the first nail in R’s coffin

Derek Jones from The Shape of Code

In 2012, when I decided to write a book on evidence-based software engineering, R was the obvious system to use for data analysis. At the time, lots of new books had “using R” or “with R” added at the end of their titles; I chose “using R”.

When developers tell me they need to do some statistical analysis, and ask whether they should use Python or R, I tell them to use Python if statistics is a small part of the program, otherwise use R.

If I started work on the book today, I would till choose R. If I were starting five-years from now, I could be choosing Python.

To understand why I think Python will eventually take over the niche currently occupied by R, we need to understand the unique selling points of both systems.

R’s strengths are that it supports a way of thinking that is a good fit for doing data analysis and has an extensive collection of packages that simplify the task of applying a wide variety of analysis techniques to data.

Python also has packages supporting the commonly used data analysis techniques. But nearly all the Python packages provide a developer-mentality interface (i.e., they provide an API like any other package), R provides data-analysis-mentality interfaces. R supports a way of thinking that data analysts can identify with.

Python’s strengths, over R, are a much larger base of developers and language support for writing large programs (R is really a scripting language). Yes, Python has a package ecosystem supporting the full spectrum of application domains, this is not relevant for analysing a successful invasion of R’s niche market (but it is relevant for enticing new developers who are still making up their mind).

StatsModels is a Python package based around R’s data-analysis-mentality interface. When I discovered this package a few months ago, I realised the first nail had been hammered into R’s coffin.

Yes, today R has nearly all the best statistical analysis packages and a large chunk of the leading edge stuff. But packages can be reimplemented (C code can be copy-pasted, the R code mapped to Python); there is no magic involved. Leading edge has a short shelf life, and what proves to be useful can be duplicated; the market for leading edge code in a mature market (e.g., data analysis) is tiny.

A bunch of bright young academics looking to make a name for themselves will see the major trees in the R forest have been felled. The trees in the Python data-analysis-mentality forest are still standing; all it takes is a few people wanting to be known as the person who implemented the Python package that everybody uses for XYZ analysis.

A collection of packages supporting the commonly (and eventually not so commonly) used data analysis techniques, with a data-analysis-mentality interface, removes a major selling point for using R. Python is a bigger developer market with support for many other application domains.

The flow of developers starting out with R will slow down, casual R users will have nothing to lose from switching when the right project comes along. There will be groups where everybody uses R and will continue to use R because that is what everybody else in the group uses. Ten-Twenty years from now R, developers could be working in a ghost town.

What statistical techniques are useful for software engineering data?

Derek Jones from The Shape of Code

What statistical techniques are of general usefulness for analyzing software engineering data?

The answer depends on the kinds of data likely to be encountered, in software engineering, and the questions likely to be asked.

When I started working on a book, aiming to cover all worthwhile publicly available software engineering data, I was hoping to refer readers to a book (or two) that they ought to read to learn the appropriate techniques. Kabacoff’s “R in Action” comes closest to the book I had in mind as a basic introduction, but there was nothing covering a wider range of topics; so I ended up writing something; I found Crawley’s “The R book”, to be the best book on the subject.

My answer to the kinds of data likely to be available was to work with all the software engineering data I could get obtain (around 600 data sets to date).

What questions should be asked about the data? My selection of questions was driven by whether the data was used in the software engineering half of the book, or the statistical analysis techniques half.

The software engineering material consists of the chapters: Introduction, Human cognitive characteristics, Cognitive capitalism, Ecosystems, Projects, Reliability and Source code. The data appeared in one of these chapters if it could be used to make (what I thought was) a practical point about the topic being discussed.

Data appeared in the statistical analysis techniques chapters, if it could be used to illustrate the technique under discussion.

What happened in practice was the software engineering material was worked on for a year or two, on realizing that bespoke statistical analysis material was needed the existing data was plundered to create the necessary chapters; after this was released, work switched back to the software engineering material (using unplundered and newly acquired data), and of course the earlier chapters plundered data from the yet to be worked on chapters.

This seems to have worked surprisingly well, at least from my perspective of keeping the production line going.

Now most if the data has been analyzed, it’s time to take a global overview and where necessary shuffle things around. I may find that everything is a complete mess; we shall see.

What techniques have I found to be useful?

The number 1, most useful data analysis technique is building a regression model. The one thing I have been consistently able to do, when analyzing other people’s data, is extract more information from it than they did (unless they also built a regression model); at times it has been embarrassing.

At number 2, is bootstrapping. Many widely used techniques only give accurate answers if the data has a normal/gaussian distribution and use of these techniques can involve a lot of arm waving involving claims about the data having a good-enough gaussian-like distribution. This arm waving was necessary before computers became available, because the practical manual techniques required a gaussian distribution. Now we have computers and techniques that don’t require any particular distribution can be used, and which in some cases are more powerful techniques than those designed for manual implementation.

Sitting here, I cannot think of a number 3; there might be one.

What techniques are not generally useful? The various tests containing some combination of the names Wilcoxon, Mann and Whitney are well past their sell-by date. Searching the source of the book I see these names still appear in one or two places; this is a hangover from the early versions from many years ago (when I was following the clueless herd) and will soon be gone.

I thought that extreme value theory might apply to some data, but have only found one data-set to which it might be applied (so not generally useful).

I spent a lot of time watching out for zero-inflated data (data containing more zero values than expected by the common probability distributions). I saw four/five papers containing plots of data that looked zero-inflated and emailed the authors asking for the data (who kindly sent it to me). None of the data turned out to be zero-inflated (I’m not sure what the authors thought about being asked for data that somebody thought was zero-inflated). This does not mean that software engineering data is not zero-inflated, only that it is not common.

My zero-inflated search was motivated by the occasional appearance of zero-truncated data (data with that does not contain zero values). Zero-truncated data occurs when counting starts at one, rather than zero (I have one data-set that is 0/1 truncated; the counting starts at 2).

I was surprised that time-series did not turn out to be widely useful.

Sometimes we are all clueless button pushers, so machine learning gets a few pages. Anybody who knows what they are doing builds regression models.

I will eventually get around to counting how many times each technique is used on the data I have (watch this blog, but don’t hold your breath).

Source code chapter added to “Evidence-based software engineering using R”

Derek Jones from The Shape of Code

The Source Code chapter of my evidence-based software engineering book has been added to the draft pdf (download here).

This chapter has suffered from coming last and there is still lots of work to be done. Almost all the source code related data has been plundered to fill up earlier chapters. Some data did not make the cut-off for release of the draft; a global review will probably result in some data migrating back to this chapter.

When talking to developers about the book I am constantly being asked ‘what is empirical software engineering?’ My explanation uses the phrase ‘evidence-based’, which everybody seems to immediately understand. It is counterproductive having a title that has to be explained, so I have changed the title to “Evidence-based Software Engineering using R”.

What is the purpose of a chapter discussing source code in a book on evidence-based software engineering? Source code is obviously an essential component of the topics discussed in the other chapters, but what is so particular to source code that it could not be said elsewhere? Having spent most of my professional life studying source code, first as a compiler writer and then involved with static analysis, am I just being driven by an attachment to the subject?

My view of source code is very different from most other developers: when developers talk about code, they spend most of the time talking about how they do things, when I talk about code I spend most of the time talking about how other developers do things (I’m a mongrel writer of code). Developers’ blinkered view of code prevents them seeing bigger pictures. I take a Gricean view of code and refrain from using meaningless marketing terms such as maintainability, readability and testability.

I have lots of source code data of interest to compiler writers (who are not the target audience) and I have lots of data related to static analysis (tool developers are not the audience). The target audience is professional software developers and hopefully what has been written is of interest to that readership.

I have been promised all sorts of data. Hopefully some of it will arrive. If somebody tells you they promised to send me data, please encourage them to take some time to sort out the data and send it.

As always, if you know of any interesting software engineering data, please tell me.

Finalizing the statistical analysis material in the second half of the book (released almost two years ago) next.

Perl’s failure to grow and Python takes over

Derek Jones from The Shape of Code

Perl, once the most widely used scripting language, has been in decline for many years; the decline now looks terminal (many decades from now, when its die-hard users have died), what happened?

Python is what happened. Why was this? Did Perl have a major fail, did Python acquire pixie dust that could not be replicated, or something else?

Some commentators point to the failure to produce a timely release of Perl 6; a major reworking of the language announced in 2000 with a stumbling release made available around 2015.

I think the real issue is a failure for Perl to take off outside its core use as a systems language. Perl is famous for its one-liners, but not for writing large programs (yes, it can be done, but would many developers would really want to?); a glance of the categories in its module library shows; those 174,970 modules (at the time of writing) are not widely spread over application domains (i.e., not catering to a wide audience).

Perl 5 was failing to grow outside its base before Perl 6 began its protracted failure to launch.

Language use is a winner take-all game, developers create more packages, support tools, and new users who combine to attract more developers. Continuing support for minority languages comes from die-hard users, existing software that is worth somebody paying to maintain and niche advantages.

These days, language success is founded on the associated package ecosystem (Go and Rust have minuscule package ecosystems, which is why they are living on borrowed time, other languages will eventually take away their sheen of trendiness). Developers use languages to build stuff, the days of writing the code for almost everything are long gone; interesting software is created by taking advantage of packages written by others. Python was in the right place, at the right time to acquire a wide variety of commercial grade packages.

It’s difficult to see Python being displaced as the lingua franca of software development. Its language features are almost irrelevant, its package ecosystem is everything. The winner will eventually take all.

I’m sure the cycle of languages becoming popular for a few years, before disappearing, will continue. There have always been, and will always be, fashionable languages.

Evolutionary pressures on C++, Java and Python

Derek Jones from The Shape of Code

The future evolution of C++, Java and Python is being driven by very different interested parties, and it’s going to be interesting watching events unfold over the next 5-10 years.

I have previously written about how the C++ Standard’s committee is past its sell-by date, has taken off its ball and chain and is now in the hands of bored consultants.

Bjarne Stroustrup was once effectively treated as C++’s Benevolent Dictator For Life (during the production of the first C++ Standard some people were labeled as Bjarne groupees); things have moved on since then, but the ‘old-guard’ are trying to make a comeback. Suggesting that people ought to base their thinking on a book published almost 25-years ago (Stroustrup’s “The Design and Evolution of C++”; a very interesting book that is well worth reading) creates a rather backward looking image. Bored consultants are looking to work on exciting new ideas. The old-guard need to appear modern to attract followers (even if the ideas are old ideas with a fresh coat of paint).

The threat to C++ is from bored consultants, each adding their own pet idea to the language standard; a situation that Stroustrup thinks is starting to happen.

Java, the language, is owned by Oracle, the company (let’s not get too involved in exactly what they own, have copyright on, etc). Oracle are not shy about asking people for licensing fees. Java is now on a 6-month release cycle (at least the Oracle version, there are Open Source implementations) and the free support only applies to the current release; paying a license fee buys support for versions older than 6-months. In the short term, the cheapest solution is for companies to pay for support.

Oracle are always happy to send in the lawyers and if too many customers switch to non-Oracle implementations, I’m sure something can be found to introduce enough uncertainty to discourage work/distribution involving Open Source Java implementations.

Will Java survive Oracle’s licensing? It is not in their interest for Java to die; Oracle will adjust their terms to keep the money flowing in, but over the longer term I think willing Java developers are going to be hard to find.

Guido van Rossum recently removed himself from the post of Python’s Benevolent Dictator For Life. One of the jobs of a benevolent dictator is maintaining some degree of language coherence, which involves preventing people’s pet ideas from being added to the language. Does this mean that Python is slowly going to be become more and more bloated? Perhaps, but I think a more likely problem is a language fork, multiple implementations of slightly different (at first) languages all claiming to be Python.

These days, the strength of Python is its large collection of very useful, commercial grade, packages, and future language details may turn out to be irrelevant. There is a lot to learn from the Python 2/3 transition, but true believers like to think that things will turn out differently for them.

Filters to help decide who might be a software developer

Derek Jones from The Shape of Code

How do you find people who are likely to be good software developers?

I use the filter approach: start with whoever is available, filter out those who are not likely candidates and go with those that are left (if any).

The first filter is a question: which language do you like to program in?

This question is positive, in that it assumes the other person is a developer; asking for the name of a language makes it a difficult to dodge question for those who don’t know any language. The language itself is irrelevant, apart from as a lead in to further discussion.

Learning to program is easy and a fun thing to do, at least if you are the kind of person likely to become a good developer. Cheap computing hardware has been available since the 1980s, the extra ingredients are a desire to write software and some degree of the necessary skills.

The next filter is a discussion about the largest software system they have written.

The theme of the discussion is how they solved the problems encountered during the implementation. Do the problems sound like something a developer of the person’s experience ought to find a problem? How much perseverance was shown in solving the problems, were they flexible in trying alternatives, what was their approach to problem solving?

Building systems is all about solving problems. People who cannot solve problems will fail, those with problem solving abilities might succeed.

What about paper qualifications?

Demand for developers continues to outstrip supply, creating an opportunity for turkeys to fly.

When getting a university degree was intellectually challenging, it was a sign of cognitive firepower. The stated aim of the UK government is for 50% of 18-year olds to study for a degree, which means that courses requiring high cognitive firepower are dumbed down (otherwise the failure rate goes through the roof and a University’s ranking suffers). If the only option is a turkey shoot, a degree in a subject requiring lots mathematical thinking (e.g., physics, chemistry, some psychology subjects, …) is obviously a much better filter than Medieval French, Modern History, etc.

There are people whose path through life has kept them away from computers when they were younger and university when they were a bit older. Software carpentry seems to be doing good things for such people; I don’t have any direct experience of working with those who have gone that route, and so cannot say anything about it.

Will this filter approach work for you? Well, it depends on the characteristics required of a good developer in your line of work.

Perhaps you need a regular Joe, who does the job, nine-to-five, and sticks to the tried and trusted approached; a solid person who keeps systems reliably maintained and customers happy.

The independent, frontier, mentality that thrives in ‘new’ fields is becoming a less tolerated in software development. The frontier shrinks as more and more software becomes good-enough and those with money to pay for change, spend it on something else.

Instructions that cpus don’t need to support

Derek Jones from The Shape of Code

What instructions can computers do without (an earlier post covered instructions they should support)?

The R in RISC was supposed to stand for Reduced, but in practice almost all the instructions you would expect were supported. What was missing were the really complicated instructions that machines of the time (last 1980s), like the VAX, supported (analysis of instruction set usage showed that these complicated instructions were rarely used; from the compiler perspective the combination sequence of operations supported by these instructions rarely occurred in code).

One instruction that was often missing from the early RISC processors was integer multiply. Compilers were expected to generate a series of instructions that had the same effect. Some of the omitted ‘basic’ instructions got added to later versions of the processors that survived commercially (e.g., SPARC).

The status register is still a common omission from RISC designs (at least for the integer operations). Where is the data showing that in the grand scheme of things (i.e., processor performance running real programs), status registers slow things down? I know that hardware designers don’t like them because they introduce bottlenecks. I don’t recall ever having seen an analysis of instruction set usage targeted at the impact of status registers on generated code. Pointers welcome.

These days, nobody seems to analyze instruction set usage like they did in times past. Perhaps Intel’s marketing and the demise of almost every cpu vendor has dampened enthusiasm for researching new cpu designs. These days most new cpu designs seem to be fashion driven, rather than data driven.

Do computers need registers? An issue that once attracted lots of research was the optimal number of registers for a processor. The minimum number of registers (or temporary storage locations) needed to evaluate an expression was known by 1970. There were various studies of the impact, on code generation, of increasing/decreasing the number of registers available to the compiler. But these studies were done using 1990s era compilers and modern compilers do many more optimizations; whole program optimization ought to be able to make use of many more registers than are probably available on today’s processors (at least I think so, until somebody does a study that shows otherwise). There is a register-less processor that is supposed to be taking the world by storm, sometime soon.

Do computers need to support the IEEE floating-point representation? Logarithmic number systems are starting to be used in various devices, but accuracy remains an issue for some applications.

Software engineering is fertile ground for the belief in silver bullets

Derek Jones from The Shape of Code

The idea that there exists some wonderful technique or methodology, which solves one or more perceived software engineering problems, was given a name in 1986; the title of Brooks’ paper No Silver Bullet is a big clue that the author does not think it exists. Indeed, over the years a steady stream of papers have attempted to dispel the idea that silver bullets exist. These attempts have two things in common: the use of reasoning and facts to make their case, and failure to dispel the idea that there are no silver bullets in software engineering.

Now, I am a great fan of reasoning using facts, but I am also a fan of evidence driven approaches to solving problems. There is now over 30 years of evidence that reasoning using facts is not an effective means of convincing people that silver bullets don’t exist.

Belief in silver bullets will not go away until it ceases to be in some peoples’ interest for them to exist.

If you have something to sell, there is a benefit to having customers believe in silver bullets: the product/research will dramatically improve performance, time to market, costs, profitability, etc…

Belief in silver bullets is not unfounded. Computing has a 70-year history of things going faster, getting cheaper and systems doing what was once thought impossible. The press has bought into this and amazing success stories abound. Having worked on a few projects that delivered faster/cheaper/impossible systems, I know that no silver bullets were involved, just lots of hard work and sometimes being in the right place at the right time. Hard work and happenstance don’t make for feel-good headlines, and rarely get mentioned in the press.

When faced with a problem, the young and inexperienced tend to be optimists; there must be a silver bullet better way of doing this that is fast/cheap/efficient. The computing field has been evolving so rapidly that many of those involved are young and inexperienced; fertile ground for belief in silver bullets to flourish.

Consequences of a belief in silver bullets in industry include, time/cost overruns on projects and money wasted on tools that are never used. In academia a belief in silver bullets results in the pointless invention of new programming languages, methodologies, programming techniques, etc.

The belief in silver bullets will not fade away until the rate of change in computing slows to a crawl and most of those involved have gained substantial experience from which they can see that results come from hard work (and some amount of luck).

Time taken to compile a source file

Derek Jones from The Shape of Code

How long will it take to compile a source file?

When computers were a lot slower than they are today, this question was of general interest. Job scheduling is more effective when reliable runtime estimates are available, and developers want to know if there is enough time to get a coffee before the compile finishes.

An embarrassing fact about compile time performance, used to be that a large percentage of compile time was spent doing lexical analysis [“The cost of lexical analysis”, I cannot find an online copy]. Why was this embarrassing? Compiler writers like to boast about all the fancy optimizations their compiler does; but doing fancy stuff consumes lots of resources, so why were compilers spending so much of their time doing simple things like lexical analysis? The reality was that fancy compiler optimizations were not commercially viable until developer computers contained tens of megabytes of memory, i.e., very few pre-1990 compilers did any real optimization (people are still fussing over lexer performance).

An analysis of the data in Captain Dennis Miller’s Masters thesis (late Rome period), finds compile time is proportional to the square root of the number of tokens in the source (code+data); more complicated models are a slightly better fit. Where did square root come from? I expected a linear relationship, but would be willing to go with log. The measurements are from Ada compilers in the mid 1980s. I know several people who worked on Ada compilers during that time, and they were implementing the latest fancy optimizations (Ada was going to be the next big thing and the venture capital was flowing; big companies, with big computers were going to be paying lots of money to use Ada, but then microcomputers came along). I think that square root is driven by OS resource limitations, the compilers are using lots of memory and a noticeable amount of time is spent swapping.

So computers got a lot faster and people lost interest in estimates of how long it would take to compile individual files. I have not seen any interest in predicting how long it would take to compile whole projects (just complaints about how long it takes). There has been some work on progress indicators, updated as compilation progresses, which is a step in the right direction. Perhaps somebody has recorded compile time information and thrown machine learning at it; I usually ignore machine learning papers applied to software engineering and perhaps I have missed something. Pointers to project compile time prediction work welcome.

Then along came just-in-time compilation. Now people want to estimate how long it will take to generate machine code from some intermediate form, that is being interpreted.

The plot below (thanks to Rafael Auler for kindly supplying the data from his paper) shows the time taken to generate code from functions containing a given number of LLVM instructions (an intermediate code), at optimization level O3. The red line is a regression fit to one of the ‘arms’ and shows constant time for less than 100’ish instructions and then a linear relationship. I have no idea why the time is roughly constant for a large number of functions.

Time taken to convert functions containing a given number of LLVM instructions to machine code

There is a lot of variation for function containing the same number of instructions. This is to be expected when lots of different optimizations are being tried; sometimes a function will contain lots of the kind of code that a particular optimization spends lot of times process and sometimes the code will not contain anything interesting (i.e., no optimizations are found).