An experiment involving matching regular expressions

Derek Jones from The Shape of Code

Recommendations for/against particular programming constructs have one thing in common: there is no evidence backing up any of the recommendations. Running experiments to measure the impact of particular language features on developer performance is not something that researchers do (there have been a handful of experiments looking at the impact of strong typing on developer performance; the effect measured was tiny).

In February I discovered two groups researching regular expressions. In the first post on duplicate regexs, I promised to say something about the second group. This post discusses an experiment comparing developer comprehension of various regular expressions; the paper is: Exploring Regular Expression Comprehension.

The experiment involved 180 workers on Mechanical Turk (to be accepted, workers had to correctly answer four or five questions about regular expressions). Workers/subjects performed two different tasks, matching and composition.

  • In the matching task workers saw a regex and a list of five strings, and had to specify whether the regex matched (or not) each string (there was also an unsure response).
  • In the composition task workers saw a regular expression, and had to create a string matched by this regex. Each worker saw 10 different regexs, which were randomly drawn from a set of 60 regexs (which had been created to be representative of various regex characteristics). I have not analysed this data yet.

What were the results?

For the matching task: given each of the pairs of regexs below, which one (of each pair) would you say workers were most likely to get correct?

         R1                  R2
1.     tri[a-f]3         tri[abcdef]3
2.     no[w-z]5          no[wxyz]5
3.     no[w-z]5          no(w|x|y|z)5
4.     [ˆ0-9]            [\D]

The percentages correct for (1) were essentially the same, at 94.0 and 93.2 respectively. The percentages for (2) were 93.3 and 87.2, which is odd given that the regex is essentially the same as (1). Is this amount of variability in subject response to be expected? Is the difference caused by letters being much less common in text, so people have had less practice using them (sounds a bit far-fetched, but its all I could think of). The percentages for (3) are virtually identical, at 93.3 and 93.7.

The percentages for (4) were 58 and 73.3, which surprised me. But then I have been using regexs since before \D support was generally available. The MTurk generation have it easy not having to use the ‘hard stuff’ 😉

See Table III in the paper for more results.

This matching data might be analysed using Item Response theory, which can take into account differences in question difficulty and worker/subject ability. The plot below looks complicated, but only because there are so many lines. Each numbered colored line is a different regex, worker ability is on the x-axis (greater ability on the right), and the y-axis is the probability of giving a correct answer (code+data; thanks to Peipei Wang for fixing the bugs in my code):

Probability of giving a correct answer, by subject ability, for 60 regex matching questions

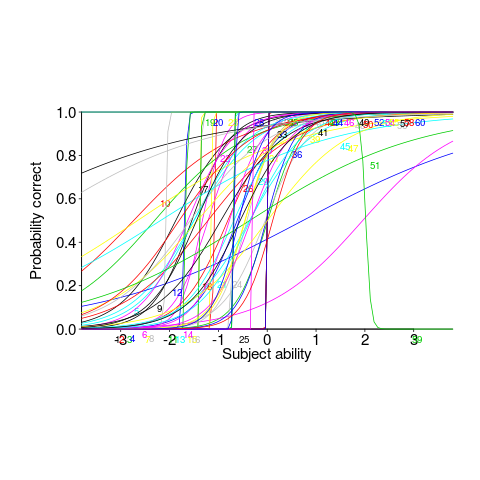
Yes, for question 51 the probability of a correct answer decreases with worker ability. Heads are being scratched about this.

There might be some patterns buried in amongst all those lines, e.g., particular kinds of patterns require a given level of ability to handle, or correct response to some patterns varying over the whole range of abilities. These are research questions, and this is a blog article: answers in the comments :-)

This is the first experiment of its kind, so it is bound to throw up more questions than answers. Are more incorrect responses given for longer regexs, particularly if they cannot be completely held in short-term memory? It is convenient for the author to use a short-hand for a range of characters (e.g., a-f), and I was expecting a difference in performance when all the letters were enumerated (e.g., abcdef); I had theories for either one being less error-prone (I obviously need to get out more).

C++ template usage

Derek Jones from The Shape of Code

Generics are a programming construct that allow an algorithm to be coded without specifying the types of some variables, which are supplied later when a specific instance (for some type(s)) is instantiated. Generics sound like a great idea; who hasn’t had to write the same function twice, with the only difference being the types of the parameters.

All of today’s major programming languages support some form of generic construct, and developers have had the opportunity to use them for many years. So, how often generics are used in practice?

In C++, templates are the language feature supporting generics.

The paper: How C++ Templates Are Used for Generic Programming: An Empirical Study on 50 Open Source Systems contains lots of interesting data :-) The following analysis applies to the five largest projects analysed: Chromium, Haiku, Blender, LibreOffice and Monero.

As its name suggests, the Standard Template Library (STL) is a collection of templates implementing commonly used algorithms+other stuff (some algorithms were commonly used before the STL was created, and perhaps some are now commonly used because they are in the STL).

It is to be expected that most uses of templates will involve those defined in the STL, because these implement commonly used functionality, are documented and generally known about (code can only be reused when its existence is known about, and it has been written with reuse in mind).

The template instantiation measurements show a 17:1 ratio for STL vs. developer-defined templates (i.e., 149,591 vs. 8,887).

What are the usage characteristics of developer defined templates?

Around 25% of developer defined function templates are only instantiated once, while 15% of class templates are instantiated once.

Most templates are defined by a small number of developers. This is not surprising given that most of the code on a project is written by a small number of developers.

The plot below shows the percentage instantiations (of all developer defined function templates) of each developer defined function template, in rank order (code+data):

Number of tasks having a given estimate.

Lines are each a fitted power law, whose exponents vary between -1.5 and -2. Is it just me, or are these exponents surprising close?

The following is for developer defined class templates. Lines are fitted power law, whose exponents vary between -1.3 and -2.6. Not so close here.

Number of tasks having a given estimate.

What processes are driving use of developer defined templates?

Every project has its own specific few templates that get used everywhere, by all developers. I imagine these are tailored to the project, and are widely advertised to developers who work on the project.

Perhaps some developers don’t define templates, because that’s not what they do. Is this because they work on stuff where templates don’t offer much benefit, or is it because these developers are stuck in their ways (if so, is it really worth trying to change them?)

Estimating in round numbers

Derek Jones from The Shape of Code

People tend to use round numbers. When asked the time, the response is often rounded to the nearest 5-minute or 15-minute value, even when using a digital watch; the speaker is using what they consider to be a relevant level of accuracy.

When estimating how long it will take to perform a task, developers tend to use round numbers (based on three datasets). Giving what appears to be an overly precise value could be taken as communicating extra information, e.g., an estimate of 1-hr 3-minutes communicates a high degree of certainty (or incompetence, or making a joke). If the consumer of the estimate is working in round numbers, it makes sense to give a round number estimate.

Three large software related effort estimation datasets are now available: the SiP data contains estimates made by many people, the Renzo Pomodoro data is one person’s estimates, and now we have the Brightsquid data (via the paper “Utilizing product usage data for requirements evaluation” by Hemmati, Didar Al Alam and Carlson; I cannot find an online pdf at the moment).

The plot below shows the total number of tasks (out of the 1,945 tasks in the Brightsquid data) for which a given estimate value was recorded; peak values shown in red (code+data):

Number of tasks having a given estimate.

Why are there estimates for tasks taking less than 30 minutes? What are those 1 minute tasks (are they typos, where the second digit was omitted and the person involved simply create a new estimate without deleting the original)? How many of those estimate values appearing once are really typos, e.g., 39 instead of 30? Does the task logging system used require an estimate before anything can be done? Unfortunately I don’t have access to the people involved. It does look like this data needs some cleaning.

There are relatively few 7-hour estimates, but lots for 8-hours. I’m assuming the company works an 8-hour day (the peak at 4-hours, rather than three, adds weight to this assumption).

New users generate more exceptions than existing users (in one dataset)

Derek Jones from The Shape of Code

Application usage data is one of the rarest kinds of public software engineering data.

Even data that might be used to approximate application usage is rare. Server logs might be used as a proxy for browser usage or operating system usage, and number of Debian package downloads as a proxy for usage of packages.

Usage data is an important component of fault prediction models, and the failure to incorporate such data is one reason why existing fault models are almost completely worthless.

The paper Deriving a Usage-Independent Software Quality Metric appeared a few months ago (it’s a bit of a kitchen sink of a paper), and included lots of usage data! As far as I know, this is a first.

The data relates to a mobile based communications App that used Google analytics to log basic usage information, i.e., daily totals of: App usage time, uses by existing users, uses by new users, operating system+version used by the mobile device, and number of exceptions raised by the App.

Working with daily totals means there is likely to be a non-trivial correlation between usage time and number of uses. Given that this is the only public data of its kind, it has to be handled (in my case, ignored for the time being).

I’m expecting to see a relationship between number of exceptions raised and daily usage (the data includes a count of fatal exceptions, which are less common; because lots of data is needed to build a good model, I went with the more common kind). So a’fishing I went.

On most days no exception occurred (zero is the ideal case for the vendor, but I want lots of exception to build a good model). Daily exception counts are likely to be small integers, which suggests a Poisson error model.

It is likely that the same set of exceptions were experienced by many users, rather like the behavior that occurs when fuzzing a program.

Applications often have an initial beta testing period, intended to check that everything works. Lucky for me the beta testing data is included (i.e., more exceptions are likely to occur during beta testing, which get sorted out prior to official release). This is the data I concentrated my modeling.

The model I finally settled on has the form (code+data):

Exceptions approx uses^{0.1}newUserUses^{0.54}e^{0.002sqrt{usagetime}}AndroidVersion

Yes, newUserUses had a much bigger impact than uses. This was true for all the models I built using data for all Android/iOS Apps, and the exponent difference was always greater than two.

Why square-root, rather than log? The model fit was much better for square-root; too much better for me to be willing to go with a model which had usagetime as a power-law.

The impact of AndroidVersion varied by several orders of magnitude (which won’t come as a surprise to developers using earlier versions of Android).

There were not nearly as many exceptions once the App became generally available, and there were a lot fewer exceptions for the iOS version.

The outsized impact of new users on exceptions experienced is easily explained by developers failing to check for users doing nonsensical things (which users new to an App are prone to do). Existing users have a better idea of how to drive an App, and tend to do the kind of things that developers expect them to do.

As always, if you know of any interesting software engineering data, please let me know.

Happy 60th birthday: Algol 60

Derek Jones from The Shape of Code

Report on the Algorithmic Language ALGOL 60 is the title of a 16-page paper appearing in the May 1960 issue of the Communication of the ACM. Probably one of the most influential programming languages, and a language that readers may never have heard of.

During the 1960s there were three well known, widely used, programming languages: Algol 60, Cobol, and Fortran.

When somebody created a new programming languages Algol 60 tended to be their role-model. A few of the authors of the Algol 60 report cited beauty as one of their aims, a romantic notion that captured some users imaginations. Also, the language was full of quirky, out-there, features; plenty of scope for pin-head discussions.

Cobol appears visually clunky, is used by business people and focuses on data formatting (a deadly dull, but very important issue).

Fortran spent 20 years catching up with features supported by Algol 60.

Cobol and Fortran are still with us because they never had any serious competition within their target markets.

Algol 60 had lots of competition and its successor language, Algol 68, was groundbreaking within its academic niche, i.e., not in a developer useful way.

Language family trees ought to have Algol 60 at, or close to their root. But the Algol 60 descendants have been so successful, that the creators of these family trees have rarely heard of it.

In the US the ‘military’ language was Jovial, and in the UK it was Coral 66, both derived from Algol 60 (Coral 66 was the first language I used in industry after graduating). I used to hear people saying that Jovial was derived from Fortran; another example of people citing the language the popular language know.

Algol compiler implementers documented their techniques (probably because they were often academics); ALGOL 60 Implementation is a real gem of a book, and still worth a read today (as an introduction to compiling).

Algol 60 was ahead of its time in supporting undefined behaviors 😉 Such as: “The effect, of a go to statement, outside a for statement, which refers to a label within the for statement, is undefined.”

One feature of Algol 60 rarely adopted by other languages is its parameter passing mechanism, call-by-name (now that lambda expressions are starting to appear in widely used languages, call-by-name has a kind-of comeback). Call-by-name essentially has the same effect as textual substitution. Given the following procedure (it’s not a function because it does not return a value):

procedure swap (a, b);
   integer a, b, temp;
begin
temp := a;
a := b;
b:= temp
end;

the effect of the call: swap(i, x[i]) is:

  temp := i;
  i := x[i];
  x[i] := temp

which might come as a surprise to some.

Needless to say, programmers came up with ‘clever’ ways of exploiting this behavior; the most famous being Jensen’s device.

The follow example of go to usage appears in: International Standard 1538 Programming languages – ALGOL 60 (the first and only edition appeared in 1984, after most people had stopped using the language):

go to if Ab < c then L17
  else g[if w < 0 then 2 else n]

Orthogonality of language use won out over the goto FUD.

The Software Preservation Group is a great resource for Algol 60 books and papers.

Having all the source code in one file

Derek Jones from The Shape of Code

An early, and supposedly influential, analysis of the Coronavirus outbreak was based on results from a model whose 15,000 line C implementation was contained in a single file. There has been lots of tut-tutting from the peanut gallery, about the code all being in one file rather than distributed over many files. The source on Github has been heavily reworked.

Why do programmers work with all the code in one file, rather than split across multiple files? What are the costs and benefits of having the 15K of source in one file, compared to distributing it across multiple files?

There are two kinds of people who work with code all in one file, novices and really capable developers. Richard Stallman is an example of a very capable developer who worked using files containing huge amounts of code, as anybody who looked at the early sources of gcc will be all to familiar.

The benefit of having all the code in one file is that it is easy to find stuff and make global changes. If the source is scattered over multiple files, then working on the code entails knowing which file to look in to find whatever; there is a learning curve (these days screens have lots of pixels, and editors support multiple windows with a different file in each window; I’m sure lots of readers work like this).

Many years ago, when 64K was a lot of memory, I sometimes had to do developer support: people would come to me complaining that the computer was preventing them writing a larger program. What had happened was they had hit the capacity limit of the editor. The source now had to be spread over multiple files to get over this ‘limitation’. In practice people experienced the benefits of using multiple files, e.g., editor loading files faster (because they were a lot smaller) and reduced program build time (because only the code that changed needed to be recompiled).

These days, 15K of source can be loaded or compiled in a blink of an eye (unless a really cheap laptop is being used). Computing power has significantly reduced these benefits that used to exist.

What costs might be associated with keeping all the source in one file?

Monolithic code makes sharing difficult. I don’t know anything about the development environment within which these researched worked. If there were lots of different programs using the same algorithms, or reading/writing the same file formats, then code reuse often provides a benefit that makes it worthwhile splitting off the common functionality. But then the researchers has to learn how to build a program from multiple source files, which a surprising number are unwilling to do (at least it has always been surprising to me).

Within a research group, sharing across researchers might be a possible (assuming they are making some use of the same algorithms and file formats). Involving multiple people in the ongoing evolution of software creates a need for some coordination. At the individual level it may be more cost-efficient for people to have their own private copies of the source, with savings only occurring at the group level. With software development having a low status in academia, I don’t see any of the senior researchers willingly take on a management role, for this code. Perhaps one of the people working on the code is much better than the others (it often happens), but are they going to volunteer themselves as chief dogs body for the code?

In the world of Open Source, where source code is available, cut-and-paste is rampant (along with wholesale copying of files). Working with a copy of somebody else’s source removes a dependency, and if their code works well enough, then go for it.

A cost often claimed by the peanut gallery is that having all the code in a single file is a signal of buggy code. Given that most of the programmers who do this are novices, rather than really capable developers, such code is likely to contain many mistakes. But splitting the code up into multiple files will not reduce the number of mistakes it contains, just distribute them among the files. Correlation is not causation.

For an individual developer, the main benefit of splitting code across multiple files is that it makes developers think about the structure of their code.

For multi-person projects there are the added potential benefits of reusing code, and reducing the time spent reading other people’s code (it’s no fun having to deal with 10K lines when only a few functions are of interest).

I’m not saying that the original code is good, bad, or indifferent. What I am saying is that the having all the source in one file may, or may not, be the most effective way of working. It’s complicated, and I have no problem going with the flow (and limiting the size of the source files I write), but let’s not criticise others for doing what works for them.

Enthusiasm on the Fortran standards committee

Derek Jones from The Shape of Code

The Fortran language standards committee, SC22/WG5, has an unusual situation on its hands. Two people have put themselves forward to chair the committee, when the current chairman’s three year term ends. What is unusual is that it is often difficult to find anybody willing to do the job.

The two candidates are the outgoing chair (the person who invariably does the job, until they decide they have had enough, or can arm wrestle someone else to do it), and a scientist at Los Alamos; I don’t know either person.

SC22 (the ISO committee responsible for language standards), and INCITS (the US Standards body; the US is the Fortran committee secretariate) will work something out.

I had heard that the new guy was ruffling some feathers, and I thought good for him (committees could do with having their feathers ruffled every now and again). Then I read the running for convenor announcement; oh dear. Every committee has a way of working: the objectives listed in this announcement would go down really well with the C++ committee (which already does many of the points listed), but the Fortran committee don’t operate this way.

The language standards world appears to be very similar to the open source world, in that they are both driven by the people who do the work. One person can have a big impact in the open source world, simply by doing the work, but in the language standards world there is voting (people can vote in the open source world by using software or not). One person can write papers and propose lots of additions to a standard, but the agreement of committee members is needed before any wording is added to a draft standard, which eventually goes out for a round of voting by national bodies.

Over the years I have seen several people on a standards committee starting out very enthusiastic, writing proposals and expounding them at meetings; then after a year or two becoming despondent because nothing has happened. If committee members don’t like your proposal (or choose to spend their time on other proposals), they do nothing. A majority doing nothing is enough to stop something happening.

Once a language has become established, many of its users want the committee to move slowly. Compiler vendors don’t want to spend all their time keeping up with language updates (which rarely help sell more product), and commercial users don’t want the hassle of having to spend time working out how a new standard might impact them (having zero impact on existing is a common aim of language committees).

The young, the enthusiastic, and magazines looking to sell clicks are excited by change. An ISO language committee is generally not the place to find it.

Beta release of data analysis chapters: Evidence-based software engineering

Derek Jones from The Shape of Code

When I started my evidence-based software engineering book, nobody had written a data analysis book for software developers, so I had to write one (in fact, a book on this topic has still to be written). When I say “I had to write one”, what I mean is that the 200 pages in the second half of my evidence-based software engineering book contains a concentrated form of such a book.

This 200 pages is now on beta release (it’s 186 pages, if the bibliography is excluded); chapters 8 to 15 of the draft pdf. Originally I was going to wait until all the material was ready, before making a beta release; the Coronavirus changed my plans.

Here is your chance to learn a new skill during the lockdown (yes, these are starting to end; my schedule has not changed, I’m just moving with the times).

All the code+data is available for you to try out any ideas you might have.

The software engineering material, the first half of the book, is also part of the current draft pdf, and the polished form should be available on beta release in about 6 weeks.

If you have a comment or find a problem, either email me or raise an issue on the book’s Github page.

Yes, a few figures and tables still bump into each other. I’m loath to do very fine-tuning because things will shuffle around a bit with minor changes to the words.

I’m thinking of running some online sessions around each chapter. Watch this space for information.

Predicting the future with data+logistic regression

Derek Jones from The Shape of Code

Predicting the peak of data fitted by a logistic equation is attracting a lot of attention at the moment. Let’s see how well we can predict the final size of a software system, in lines of code, using logistic regression (code+data).

First up is the size of the GNU C library. This is not really a good test, since the peak (or rather a peak) has been reached.

Growth of glibc, in lines,, with logistic regression fit

We need a system that has not yet reached an easily recognizable peak. The Linux kernel has been under development for many years, and lots of LOC counts are available. The plot below shows a logistic equation fitted to the kernel data, assuming that the only available data was up to day: 2,900, 3,650, 4,200, and 5,000+. Can you tell which fitted line corresponds to which number of days?

Number lines in Linux kernel, on days since release1, and four fitted logistic regression models.

The underlying ‘problem’ is that we are telling the fitting software to fit a particular equation; the software does what it has been told to do, and fits a logistic equation (in this case).

A cubic polynomial is also a great fit to the existing kernel data (red line to the left of the blue line), and this fitted equation can be extended into future (to the right of the blue line); dotted lines are 95% confidence bounds. Do any readers believe the future size of the Linux kernel predicted by this cubic model?

Number of distinct silhouettes for a function containing four statements

Predicting the future requires lots of data on the underlying processes that drive events. Modeling events is an iterative process. Build a model, check against reality, adjust model, rinse and repeat.

If the COVID-19 experience trains people to be suspicious of future predictions made by models, it will have done something positive.

Motzkin paths and source code silhouettes

Derek Jones from The Shape of Code

Consider a language that just contains assignments and if-statements (no else arm). Nesting level could be used to visualize programs written in such a language; an if represented by an Up step, an assignment by a Level step, and the if-terminator (e.g., the } token) by a Down step. Silhouettes for the nine possible four line programs are shown in the figure below (image courtesy of Wikipedia). I use the term silhouette because the obvious terms (e.g., path and trace) have other common usage meanings.

Number of distinct silhouettes for a function containing four statements

How many silhouettes are possible, for a function containing n statements? Motzkin numbers provide the answer; the number of silhouettes for functions containing from zero to 20 statements is: 1, 1, 2, 4, 9, 21, 51, 127, 323, 835, 2188, 5798, 15511, 41835, 113634, 310572, 853467, 2356779, 6536382, 18199284, 50852019. The recurrence relation for Motzkin numbers is (where n is the total number of steps, i.e., statements):

(n+2)m_n = (2n+1)m_{n-1}+3(n-1)m_{n-2}

Human written code contains recurring patterns; the probability of encountering an if-statement, when reading code, is around 17% (at least for the C source of some desktop applications). What does an upward probability of 17% do to the Motzkin recurrence relation? For many years I have been keeping my eyes open for possible answers (solving the number theory involved is well above my mathematics pay grade). A few days ago I discovered weighted Motzkin paths.

A weighted Motzkin path is one where the Up, Level and Down steps each have distinct weights. The recurrence relationship for weighted Motzkin paths is expressed in terms of number of colored steps, where: l is the number of possible colors for the Level steps, and d is the number of possible colors for Down steps; Up steps are assumed to have a single color:

(n+2)m_n = d(2n+1)m_{n-1}+(4c-d^2)(n-1)m_{n-2}

setting: c=1 and d=1 (i.e., all kinds of step have one color) recovers the original relation.

The different colored Level steps might be interpreted as different kinds of non-nesting statement sequences, and the different colored Down steps might be interpreted as different ways of decreasing nesting by one (e.g., a goto statement).

The connection between weighted Motzkin paths and probability is that the colors can be treated as weights that add up to 1. Searching on “weighted Motzkin” returns the kind of information I had been looking for; it seems that researchers in other fields had already discovered weighted Motzkin paths, and produced some interesting results.

If an automatic source code generator outputs the start of an if statement (i.e., an Up step) with probability a, an assignment (i.e., a Level step) with probability b, and terminates the if (i.e., a Down step) with probability c, what is the probability that the function will contain at least n-1 statements? The answer, courtesy of applying Motzkin paths in research into clone cell distributions, is:

P_n=sum{i=0}{delim{[}{(n-2)/2}{]}}(matrix{2}{1}{{n-2} {2i}})C_{2i}a^{i}b^{n-2-2i}c^{i+1}

where: C_{2i} is the 2i‘th Catalan number, and that [...] is a truncation; code for an implementation in R.

In human written code we know that a != c, because the number of statements in a compound-statement roughly has an exponential distribution (at least in C).

There has been some work looking at the number of peaks in a Motzkin path, with one formula for the total number of peaks in all Motzkin paths of length n. A formula for the number of paths of length n, having k peaks, would be interesting.

Motzkin numbers have been extended to what is called higher-rank, where Up steps and Level steps can be greater than one. There are statements that can reduce nesting level by more than one, e.g., breaking out of loops, but no constructs increase nesting by more than one (that I can think of). Perhaps the rather complicated relationship can be adapted to greater Down steps.

Other kinds of statements can increase nesting level, e.g., for-statements and while-statements. I have not yet spotted any papers dealing with the case where an Up step eventually has a corresponding Down step at the appropriate nesting level (needed to handle different kinds of nest-creating constructs). Pointers welcome. A related problem is handling if-statements containing else arms, here there is an associated increase in nesting.

What characteristics does human written code have that results in it having particular kinds of silhouettes? I have been thinking about this for a while, but have no good answers.

If you spot any Motzkin related papers that you think could be applied to source code analysis, please let me know.